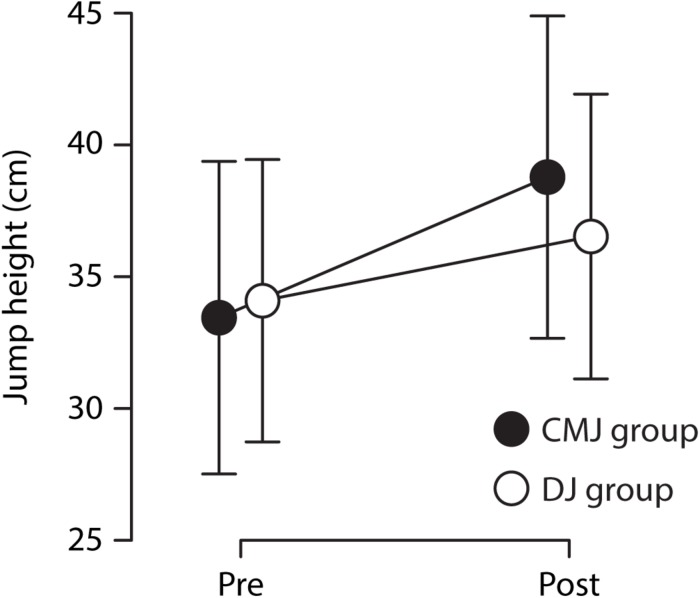
FIGURE 2.
Mean jump heights (over all jump types) for the countermovement jump (CMJ) and the drop jump (DJ) training groups before (Pre) and after (Post) training. Statistical analysis showed that the improvement was significantly greater in the CMJ training group (p < 0.001). Error bars represent the standard deviation.

