
Fig. 1.
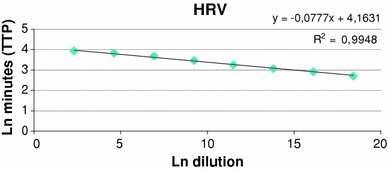
Standard curve of HRV real-time NASBA assay. HRV TTP values were regressed against the standard curve to generate a predicted amount of target RNA. HRV ln dilutions (108 to 10 copies/reaction) on x-axis are plotted against ln minutes (TTP) on y-axis. The coefficient of correlation (R 2) was 0.9948. TTP time to positivity, Ln natural logarithm