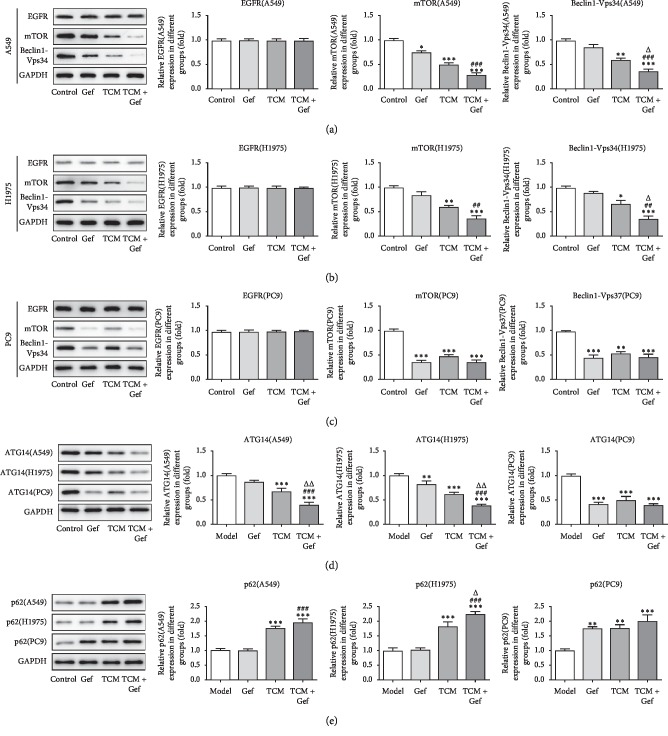
Figure 2.
XLEP promotes the autophagy of A549, H1975 and PC9 cells. (a) The expression of EGFR, mTOR and Beclin1-Vps34 in A549 cells was detected by Western blot analysis. ∗P < 0.05, ∗∗P < 0.01 and ∗∗∗P < 0.001 vs. control group. ###P < 0.001 vs. Gef group. ΔP < 0.05 vs. TCM group. (b) The expression of EGFR, mTOR and Beclin1-Vps34 in H1975 cells was detected by Western blot analysis. ∗P < 0.05, ∗∗P < 0.01 and ∗∗∗P < 0.001 vs. control group. ##P < 0.01 vs. Gef group. ΔP < 0.05 vs. TCM group. (c) The expression of EGFR, mTOR, and Beclin1-Vps34 in PC9 cells was detected by western blot analysis. ∗∗P < 0.01 and ∗∗∗P < 0.001 vs. control group. (d) The ATG14 expression in A549, H1975, and PC9 cells was measured by western blot analysis. ∗∗P < 0.01 and ∗∗∗P < 0.001 vs. control group. ###P < 0.001 vs. Gef group. ΔΔP < 0.01 vs. TCM group. (e) The p62 expression in A549, H1975, and PC9 cells was measured by western blot analysis. ∗∗P < 0.01 and ∗∗∗P < 0.001 vs. control group. ###P < 0.001 vs. Gef group. ΔP < 0.05 vs. TCM group.

