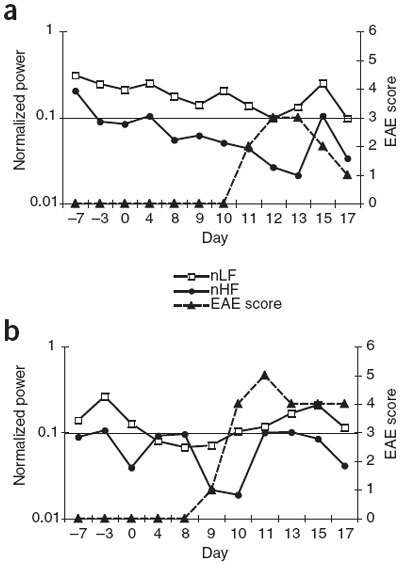
Figure 4. Time domain analysis of HRV in device-implanted mice.

We observed a loss of variability in the inter-beat interval immediately before or after EAE onset relative to pre-disease induction in the normalized low frequency (nLF) and normalized high frequency (nHF) ranges. Day 0 indicates day of T-cell transfer for EAE induction. (a) Mouse 2. (b) Mouse 4.
