
Figure 3. ACE2 deficiency increases the severity of H5N1-induced acute lung injury.
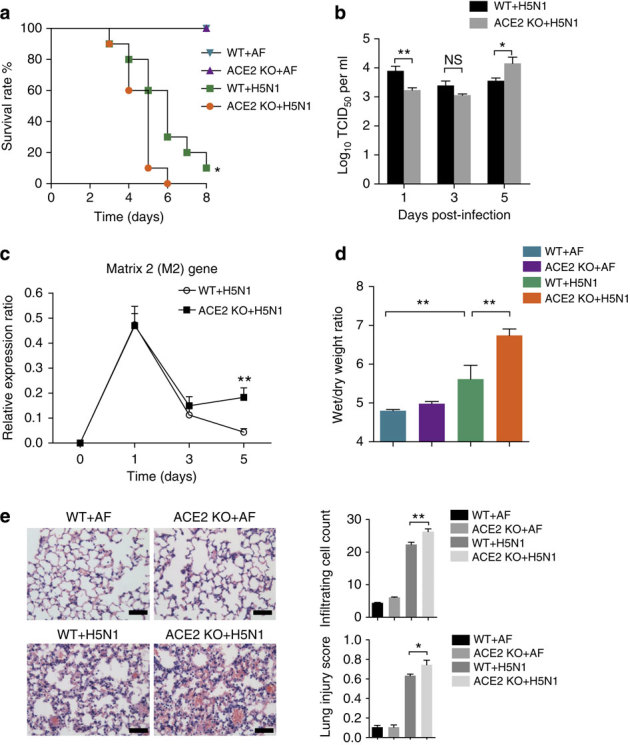
Wild-type (WT) and ACE2-knockout (ACE2 KO) mice were intratracheally instilled with vehicle control (allantoic fluid, AF) or live H5N1 virus (106 TCID50). (a) Kaplan-Meier survival curves were recorded. n=9–10 mice per group. *P<0.05 (log-rank test) when comparing the (ACE2 KO+H5N1) group with the (WT+H5N1) group. (b) Virus titers in wild-type or ACE2 KO mouse lung were assessed 1, 3 and 5 days after H5N1 infection, n=3–5 mice per time point (mean±s.e.m.). *P<0.05, **P<0.01 (two-tailed t-test). (c) Relative mRNA expression levels of the influenza A matrix 2 (M2) gene in the lungs of wild type and ACE2 knockout mice at an indicated time were determined by real-time PCR, n=3–5 mice per time point (mean±s.e.m.). **P<0.01 (two-tailed t-test). (d) Wet to dry weight ratios of the lungs analyzed 3 days after intratracheal instillation of AF as a control or live H5N1 virus. n=4–6 mice per group (mean±s.e.m.). **P<0.01 (two-tailed t-test). (e) Representative images of the lung pathology of WT and ACE2 KO mice 3 days after intratracheal instillation of AF or live H5N1 virus. Scale bar=100 μm. The numbers of infiltrating cells per microscopic field (mean±s.e.m.; top panel) and lung injury scores (mean±s.e.m., bottom panel) are shown in the bar graphs. n=100 fields analyzed for three mice for each treatment. *P<0.05, **P<0.01 (two-tailed t-test). Each experiment was repeated at least twice.