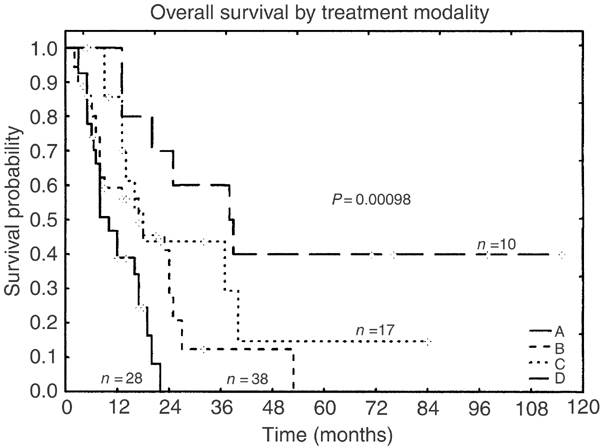
Figure 2.

Kaplan–Meier curves of the overall survival for different therapies: A – chemotherapy less intensive than CHOP, including symptomatic therapy and local irradiation; B – CHOP and CHOP-like regimens; C – therapy for acute leukemia; D – autologous or allogeneic stem cell transplantation.
