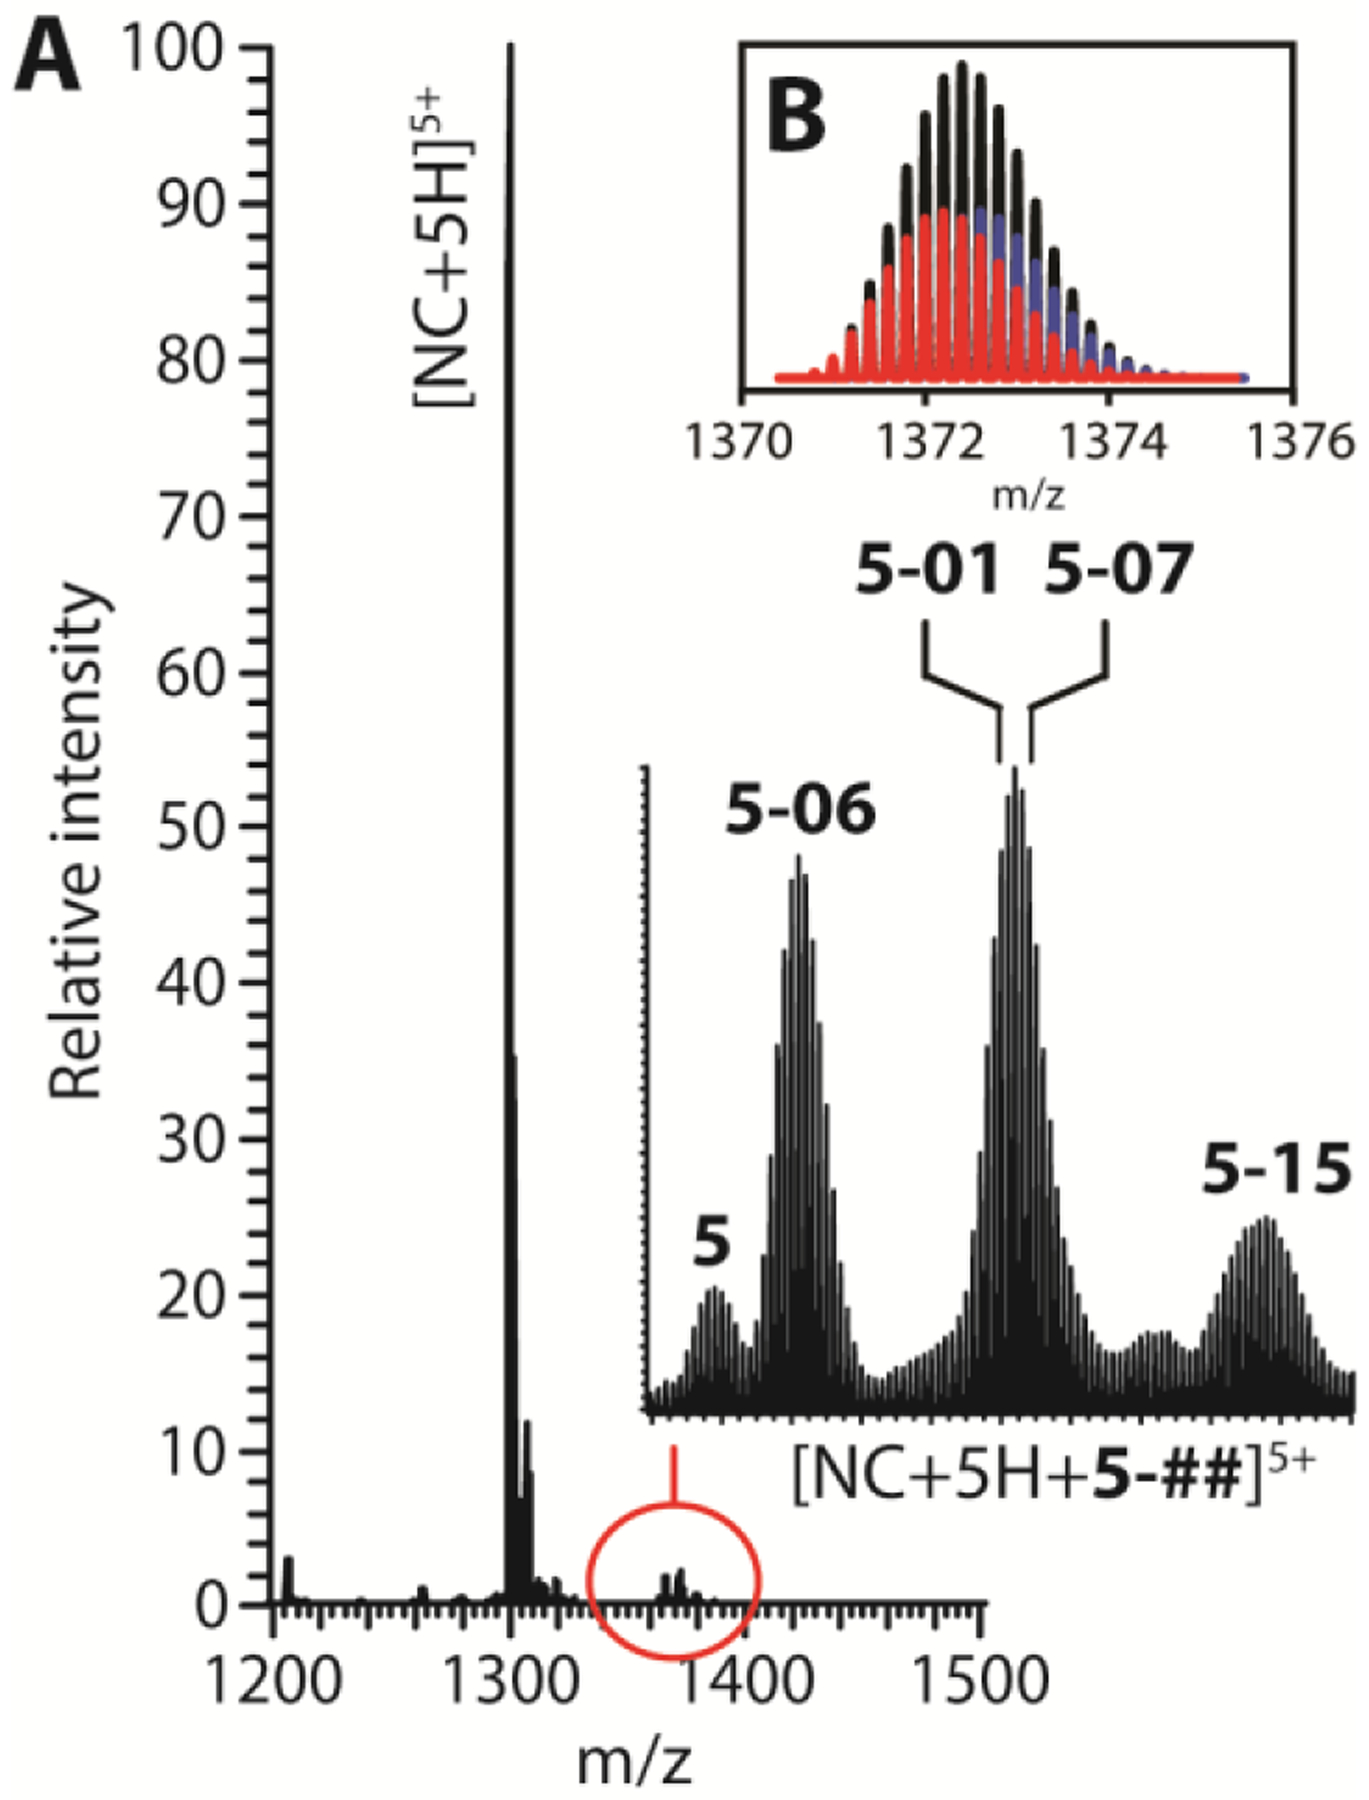
Figure 5.

ESI-MS spectrum of a sample containing 5 μM NC and 1-fold molar concentration of a ligand mixture containing 5, 5–01, 5–06, 5–07 and 5–15 (see Materials and Methods for details). The inset displays the isotopic distributions observed for the various complexes (A). A putative partitioning between complexes containing the nearly isobaric 5–01 (red) and 5–07 (blue) compounds was calculated by arbitrarily assigning equivalent binding affinities before fitting their combined intensities to the overall experimental distribution (black) (B). Additional signals corresponding to typical sodium, potassium and ammonium adducts were also detected with much lower intensities.
