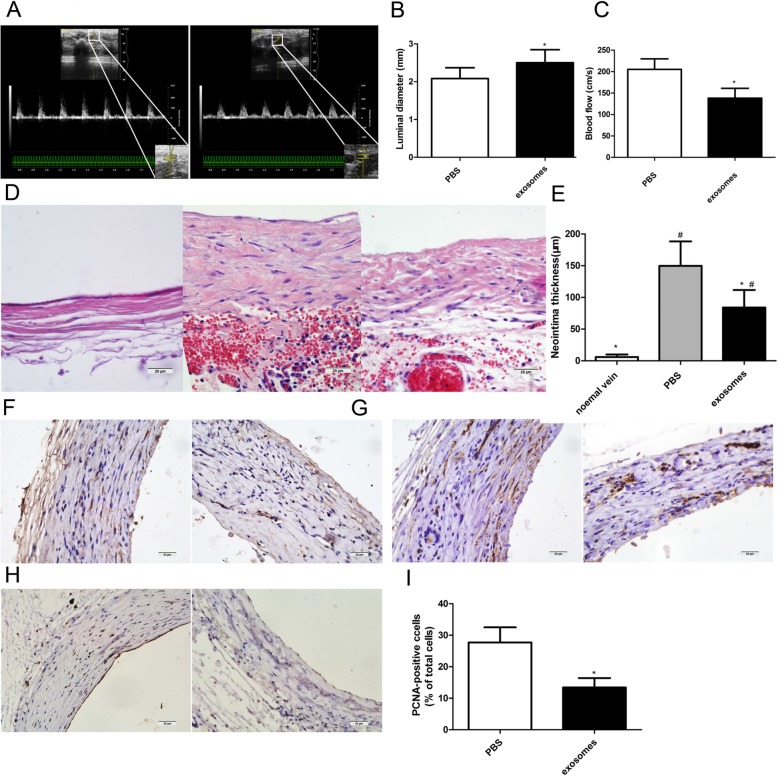
Fig. 2.
hucMSC-exosomes inhibited intimal hyperplasia and luminal stenosis in arterialized vein grafts. a Representative ultrasound images of vein grafts from the PBS group (left panel) and exosome group (right panel). Quantification of the luminal diameter (b) and peak-systolic velocity (c) in vein grafts. d Histologic images of haematoxylin and eosin staining (HE) staining in vein grafts from the normal vein group (left panel), PBS group (middle panel), and exosome group (right panel). e Quantification of the neointimal thickness in vein grafts. f Immunohistochemical staining of matrix metalloproteinase 2 (MMP-2) in vein grafts from the PBS group (left panel) and exosome group (right panel). g Immunohistochemical staining of matrix metalloproteinase 9 (MMP-9) in vein grafts from the PBS group (left panel) and exosome group (right panel). h Immunohistochemical staining of proliferating cell nuclear antigen (PCNA) in vein grafts from the PBS group (left panel) and exosome group (right panel). i Quantitative analysis of PCNA-positive index in vein grafts. The PCNA-positive index was quantified as the percentage of total nuclei in the neointima. Scale bar is 200 μm in panels d, f, g, and h. The results are presented as the mean ± SD, n = 6 for each group. An asterisk represents statistically significant difference compared with the PBS group (P < 0.05). Number sign represents statistically significant difference compared with the normal vein group (P < 0.05)

