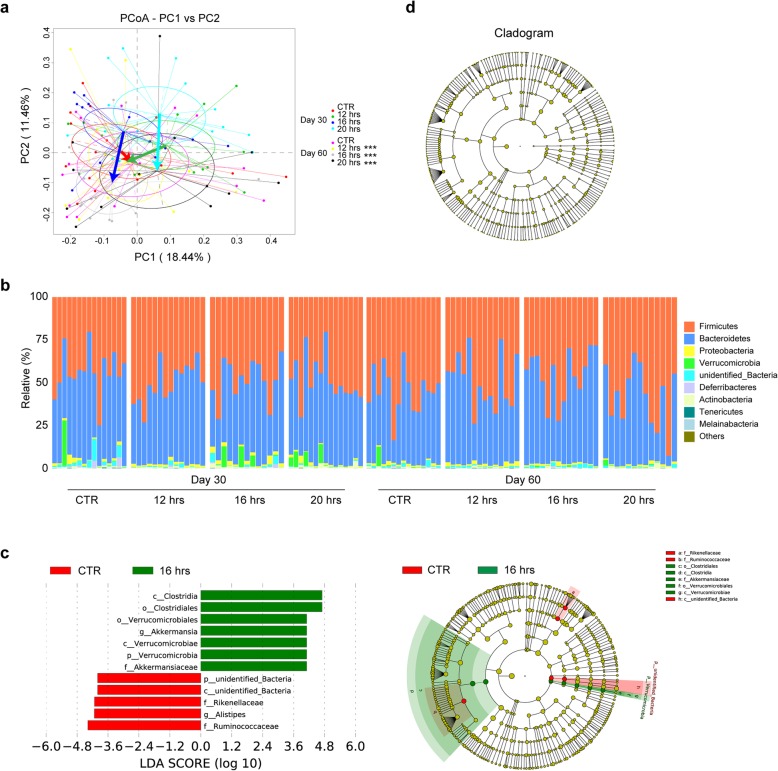
Fig. 3.
Analysis of gut bacterial communities by 16S rRNA analysis from fed and fasted mice. a Principal Co-ordinates Analysis (PCoA) on Bray-Curtis dissimilarities of bacterial communities from four different fasting regimens at two time points. Each point corresponds to a community from a single mouse. Colors indicate community identity. Ellipses show the 95% confidence intervals. Coloured arrows indicate community shift from day 30 to day 60. Intra-group differences were indicated by using ANOSIM test. ***p ≤ 0.001. b The Figure shows the percentage of each community contributed by the indicated phyla. Time point and daily fasting durations are indicated below the Figure. Taxa that discriminated between fasted and control mice during fasting (c) or 1 month after the cessation of fasting (d). Taxa with a log LDA (linear discriminant analysis) score above 4.00 as determined by using LEfSe. Data shown are the log10 linear discriminant analysis (LDA) scores following LEfSe analyses and the hierarch of discriminating taxa visualized as cladograms for taxonomic comparisons between fasted and control mice

