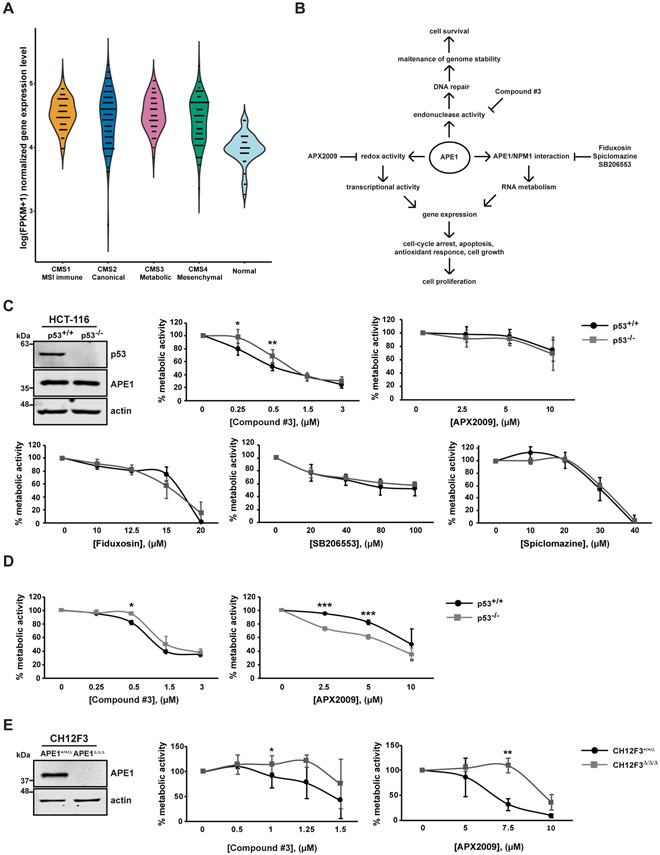
Fig. 1. APE1 is overexpressed in colorectal cancer and the inhibition of its endonuclease activity triggers p53-mediated effects on cell metabolism.
(A) Gene expression level of APEX1 in the CRC samples of the four CMS classes and normal controls (CMS1 MSI Immune n=71; CMS2 Canonical n=130; CMS3 Metabolic n=58; CMS4 Mesenchymal n=98; control n=42). For left to right, the violin plots illustrate the log(FPKM+1) normalized gene expression level in the CMS 1-4 class CRC and normal control samples, respectively. (B) Schematic representation of different functions of APE1. The specific inhibitors of the different functions of APE1 are also indicated. (C) Western blot analysis of p53 and APE1 protein levels in HCT116 p53+/+ and p53−/− cell lines. Actin was used as a loading control. MTS assay on HCT-116 p53+/+ and p53−/− cell lines. Cells were treated with increasing amounts of APE1 inhibitors (Compound #3, APX2009, Fiduxosin, SB206553 and Spiclomazine) at the indicated concentrations for 48 h. Untreated cells were treated with DMSO. In graph, the percentage of metabolic activity relative to untreated cells, arbitrary set to 100%, is represented. Values are mean±SD (n≥3). (D) RealTime Glo assay on HCT-116 p53+/+ and p53−/− cell lines. Cells were treated with increasing amounts of Compound #3 or APX2009 for 48 h. Untreated cells were treated with DMSO. In graph, the percentage of metabolic activity relative to untreated cells, arbitrary set to 100%, is represented. Values are mean±SD (n=3). (E) Western blot analysis of APE1 in CH12F3+/+/Δ and CH12F3Δ/Δ/Δ cell lines. Actin was used as a loading control. CellTiter assay on CH12F3+/+/Δ and CH12F3Δ/Δ/Δ cell lines. Cells were treated with increasing amounts of Compound #3 or APX2009 at the indicated concentrations for 48 h. The percentages of viable cells relative to untreated cells, arbitrary set to 100%, are represented in graph. Values are mean±SD (n=3). Data were evaluated statistically by two-tails Student t-test. Resulting p-value is indicated (* p<0.05, ** p<0.01, *** p<0.005).

