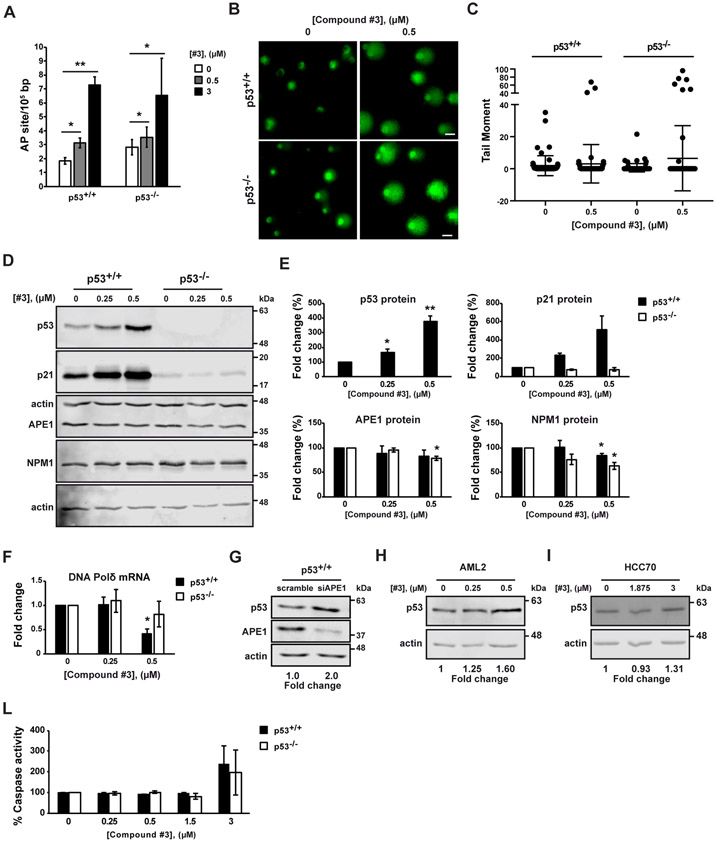
Fig. 2. Inhibition of APE1-endonuclease activity promotes p53 activation.
HCT-116 p53+/+ and p53−/− cell lines were treated with Compound #3 (#3) at the indicated concentrations for 48h. Untreated cells were treated with DMSO (A-F, L). (A) The amount of abasic (AP) sites was measurement. Values are mean±SD (n=3). (B) Representative fluorescence confocal microscope images of in vitro comet assay. Scale bars, 25 μm. (C) Tail moment was analysed for 100 cells at random by OpenComet software. Untreated cells was used as reference and set to 1. Values are mean±SD. (D) Western blot analysis of p53, p21, APE1 and Nucleophosmin (NPM1) protein levels. Actin was used as a loading control (n=3). (E) Densitometric analysis of p53, p21, APE1 and NPM1 protein expression. Levels were normalized to actin. Fold change values relative to untreated control cells, arbitrary set to 100%, are shown. Values are mean±SD (n=3). (F) Expression level of DNA Polimerase δ (DNA Pol δ) was determined by qRT-PCR analysis. DNA Pol δ levels were normalized to β-actin. Fold change values relative to untreated control cells, arbitrary set to 1, are shown. Values are mean±SD (n=3). (G) HCT116 p53+/+ cell lines silenced for APE1 expression. Western blot analysis of p53 and APE1 protein levels. Actin was used as a loading control. Fold change values relative to untreated control cells, arbitrary set to 1, are shown. (H and I) Western blot analysis of p53 protein levels upon Compound #3 (#3) at the indicated concentrations of AML2 cell lines treated with for 48 h (H) and HCC70 cell lines treated for 24 h (I). Actin was used as a loading control. Fold change values relative to untreated control cells, arbitrary set to 1, are shown (n=3). (L) Apo-ONE assay was used to quantify relative levels of apoptosis. The activities of caspases 3/7 were examined using a fluorescence-based assay. Untreated control cells were used as reference and set to 100%. Values are mean±SD (n=2). Data were evaluated statistically by two-tails Student t-test. Resulting p-value is indicated (* p<0.05, ** p<0.01).

