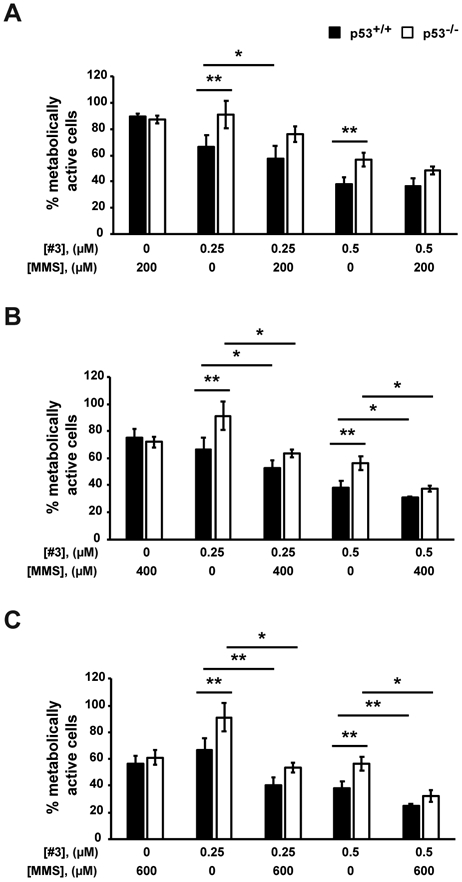
Fig. 5. Inhibition of APE1-endonuclease activity sensitises p53 expressing cell lines to MMS treatment.

MTS assay on HCT-116 p53+/+ and HCT-116 p53−/− cells. Cells were treated with Compound #3 (#3) at the indicated concentrations for 40 h and in combination with 200 μM (A), 400 μM (B) or 600 μM (C) methyl methanesulfonate (MMS) for additional 8 h. Untreated cells were treated with DMSO. In graph, the percentage of metabolic activity relative to untreated cells, arbitrary set to 100%, is represented. Values are mean±SD (n=3). Data were evaluated statistically by two-tails Student t-test. Resulting p-value is indicated (* p<0.05, ** p<0.01).
