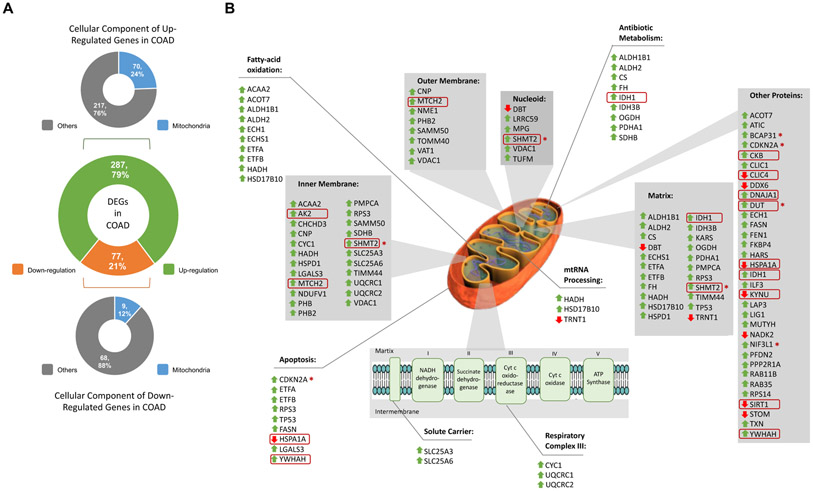
Fig. 7. Differentially expressed interactors of APE1 in colorectal cancer.
(A) Differentially expressed genes (DEGs) coding APE1 interactors in colon cancer (COAD) are in the middle. Cellular locations of upregulated interactors in upper panel and downregulated interactors in lower panel. The colour codes are as follows: green colour for up-regulation, orange colour for down-regulation, blue colour for mitochondrial location and grey colour for other cellular locations. (B) Representation of DEGs on mitochondrial scheme. Grey shaded boxes indicate mitochondrial locations while boxes without any shade indicate enriched pathways. Green upside arrows indicate up-regulation while red downside arrows indicate down-regulation. Genes that were also regulated in previously published microarray data were shown in red circles. Poor prognostic interactors were marked with circled skull symbol.

