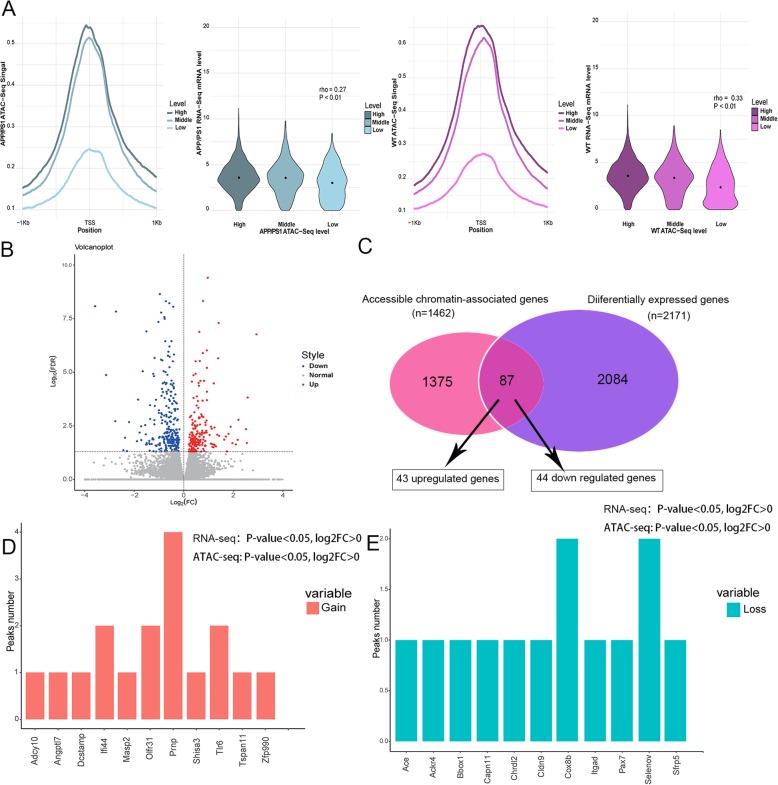
Fig. 3.
The association between the AD-specific chromatin-accessible regions and gene expression in AD mice. a ATAC-seq signal at TSSs correlates quantitatively with gene expression, the left figures (in blue) show the correlation between ATAC-seq signal at TSS and gene expression in AD mice, and the right figures (in pink) show the correlation between ATAC-seq signal at TSS and gene expression in WT mice. b Volcano plot of differentially expressed genes in AD, upregulated genes are shown by red dots and downregulated genes are shown by blue dots. c Venn diagram showing genes associated with the chromatin-accessible regions in AD and differentially expressed genes. d Upregulated genes in AD that are associated with AD-specific open chromatin regions. e Downregulated genes in AD that are associated with AD-specific closed chromatin regions

