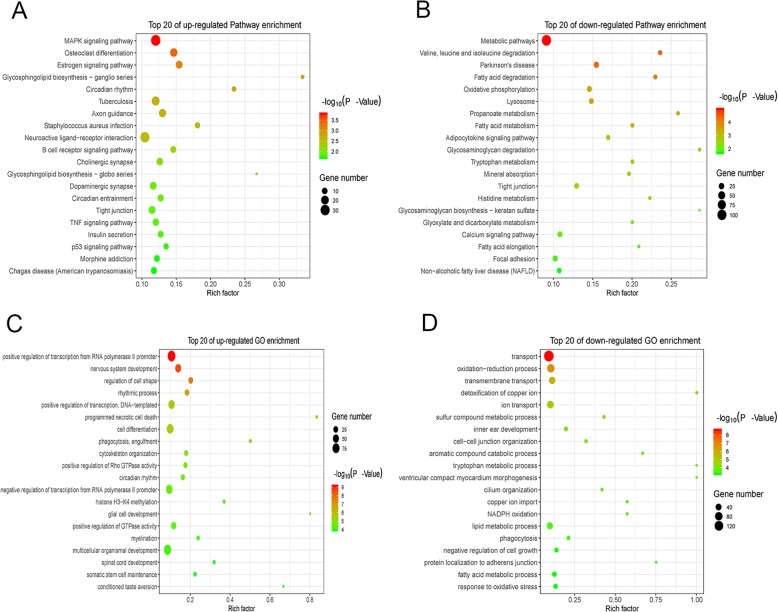
Fig. 5.
Gene enrichment in signaling pathways and GO analysis. a Upregulated gene enrichment in signaling pathways (20 most enrichment signaling pathways are listed). b Downregulated gene enrichment in signaling pathways (20 most enrichment signaling pathways are listed). c Upregulated gene enrichment in biological process (20 most enrichment biological process are listed). d Downregulated gene enrichment in biological process (20 most enrichment biological process are listed). The rich factor is defined as the ratio of the number of differential genes enriched in the pathway to the number of annotated genes

