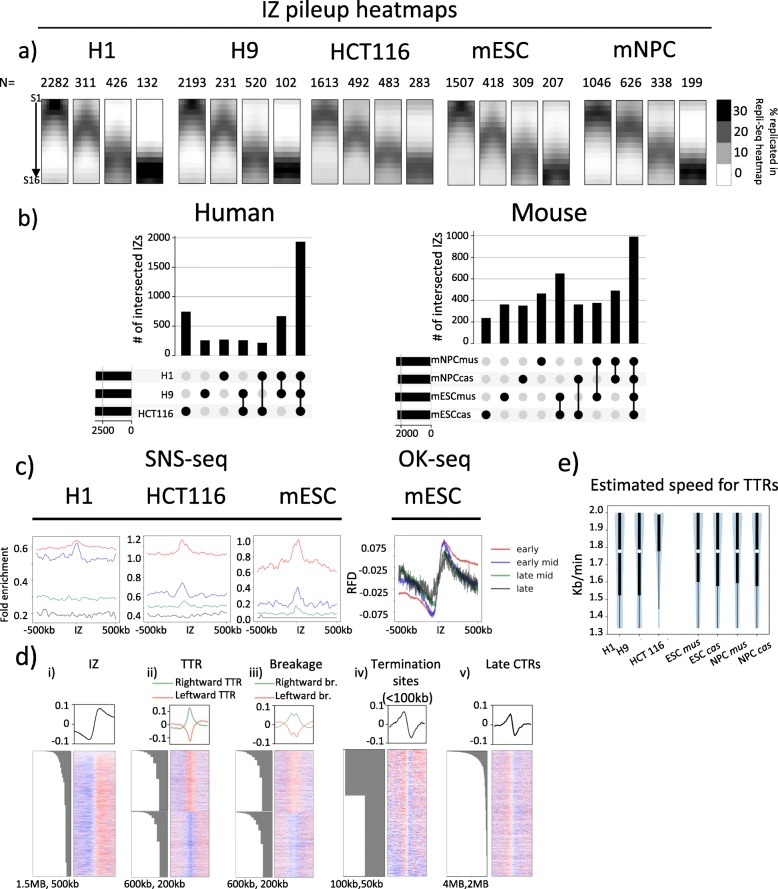
Fig. 2.
High-resolution Repli-Seq identifies features highly concordant with Ok-seq. a Pile-ups of IZs that are categorised into four categories: early, early-mid, late-mid and late by the timing of initiation in H1 and H9 hESCs, HCT116, F121-9 mESCs and mNPCs. The number of IZs in each category is shown on top of the pile-up heatmap. b UpSet plots showing numbers of IZs either unique to each cell type alone or uniquely in common between the connected cell types in human and mouse cell lines. Black bars on the lower left are total IZs in each cell type. c Mean line plots showing SNS-seq signal (for H9, HCT116 and mESCs) and OK-seq signal (for mESCs) centred at IZs of early (red), early-mid (blue), late-mid (green) and late (black) RT ± 500 kb. d Mean line plots (top row) and heatmaps (bottom row) showing mESC OK-seq signal centred at centres of IZs (i), TTRs (ii), breakages (iii), termination sites (< 100 kb) (iv) and termination sites (> 100 kb) (v) ± 1 MB from feature centre. Negative values indicate an enrichment for Okazaki fragments at leftward fork and positive values indicate an enrichment for Okazaki fragments at rightward fork. Each row in a heatmap represents a single site of any feature. Heatmaps are sorted by row using site size. Barplots indicating feature size associated with the corresponding row are on the left of the heatmap. TTR (ii) and breakage (iii) heatmaps are arranged so that rightward TTR/breakages are stacked on top of leftward TTR/breakage and sorted separately. Green and orange mean line plots represent the rightward and left leftward TTRs, respectively. e Distribution of estimated TTR speed in kb/min for H1, H9, HCT116, mESC and mNPC. White dots represent the medians of distribution. Thick black lines mark the distribution between the first quartile to the third quartile. Thin black lines indicate the complete distribution of TTR speeds

