6.

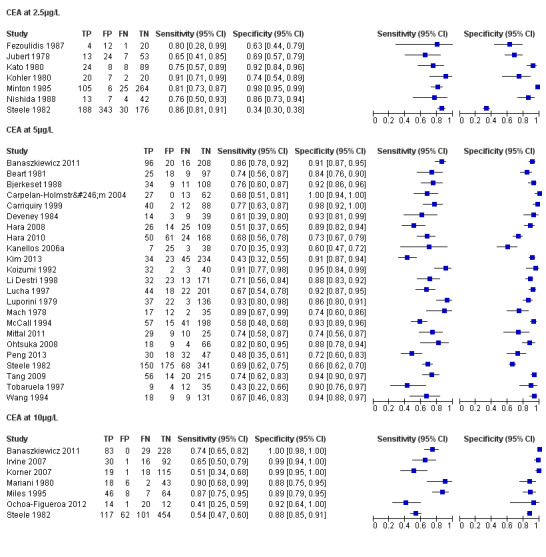
Forest plot broken down by threshold: CEA at 2.5µg/L, CEA at 5µg/L, CEA at 10µg/L.
TP = true positive; FP = false positive; FN = false negative; TN = true negative
The blue square depicts the sensitivity and specificity for each study and the horizontal line represents the corresponding 95% confidence intervals for these estimates.
