9.

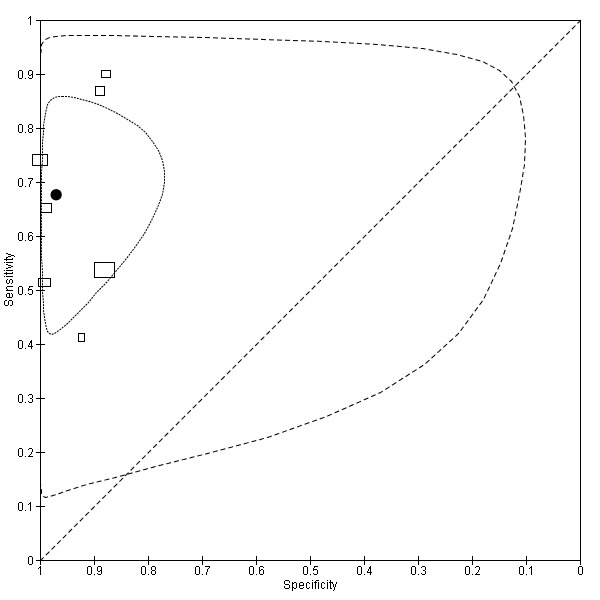
Summary ROC plot of accuracy at a threshold of 10 µg/L.
Each box represents the 2 x 2 data extracted from each study.
The width of the box is proportional to the number of patients who did not experience recurrence in each study, and the height is proportional to the number of patients that did develop recurrent CRC.
The filled circle is the pooled estimate for sensitivity and specificity and the line running through it is the summary ROC curve.
The smaller dotted ellipse represents the 95% credible region around the summary estimate; the larger dashed ellipse represents the 95% prediction region.
