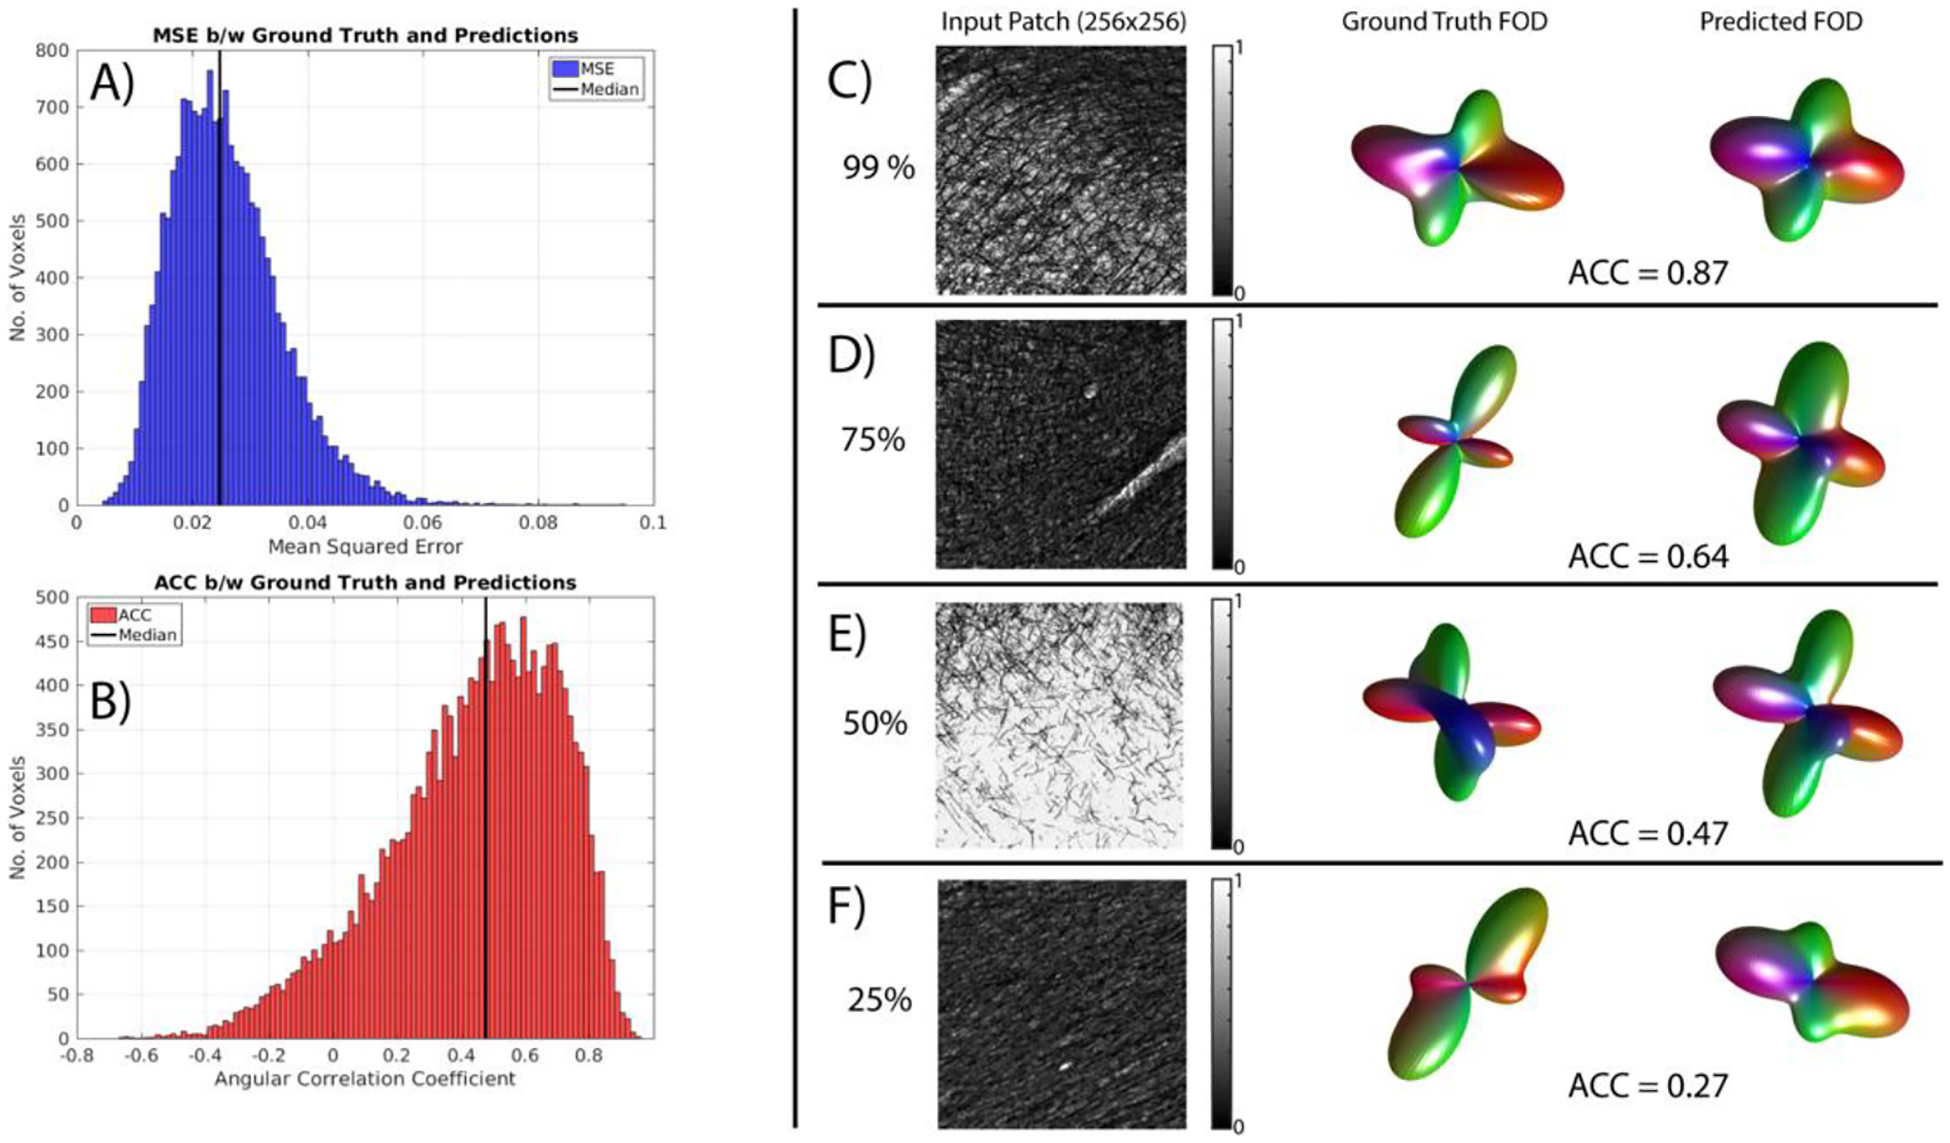
Fig. 3. Estimated 3D FODs show moderate to high agreement with ground truth.

The CNN minimizes the MSE of SH coefficients between ground truth and predictions (A), resulting in ACC values with median correlations of 0.49. Example myelin-stained patches, ground truth FODs and predicted FODs are shown for varying levels of reconstruction accuracy (C-F).
