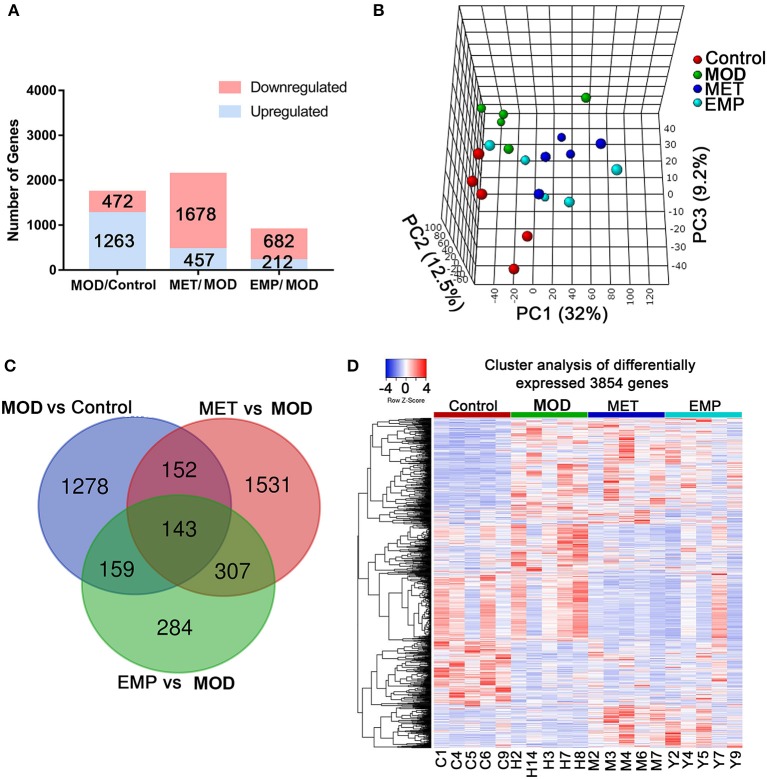
Figure 3.
MET and EMP alter liver transcription. Rat livers were collected and then subjected to RNA-seq gene expression analysis. (A) The number of upregulated (blue) and downregulated (red) genes from the MOD/control, MET/MOD, and EMP/MOD categories in the rat liver genome. (B) 3D view of PLS-DA analysis of the control, MOD, MET, and EMP groups. (C) The Venn diagram shows an overlap among the MOD/control, MET/MOD, and EMP/MOD genes. (D) Heat maps of the most differentially expressed genes from control, MOD, MET, and EMP comparisons. Each column represents an individual animal.

