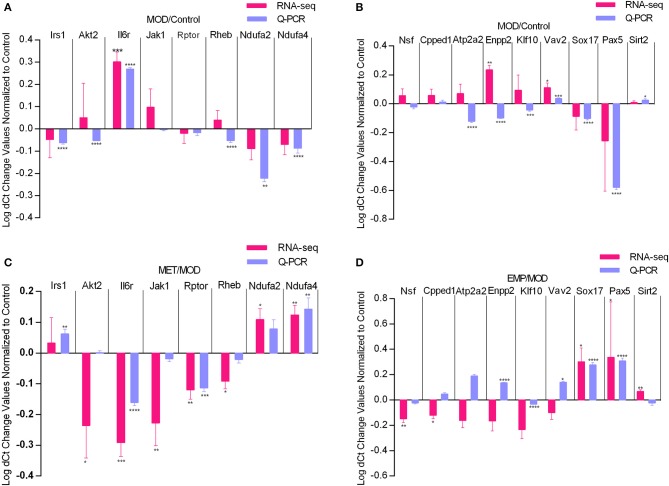
Figure 6.
Quantitative real-time PCR validation of RNA-seq analysis of DEGs affected by MET and EMP treatment. Graphs represent logarithmic mean fold changes for MOD values normalized to those of the control (A,B) for MET values normalized to those of MOD (C) and for EMP values normalized to those of the MOD (D). *p < 0.05, **p < 0.01, ***p < 0.001, ****p < 0.0001.

