FIGURE 2.
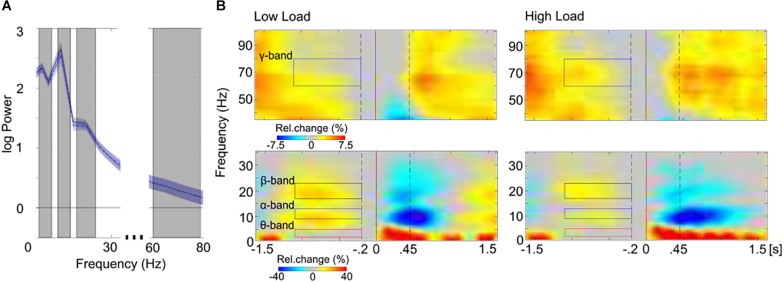
Spectral (A) and spectro-temporal (B) distribution of maintenance activity. (A) The mean overall power spectrum (log power; SEM, shaded area) is displayed separately for the low load (black line) and the high load (blue dashed line) conditions. Power values of the averaged maintenance activity (–1.1 to –0.2 s) were averaged across all voxels and across participants of all training groups. The gray boxes highlight the pre-selected frequency-bands that were used for further analyses (from left to right: theta, 2.5–5 Hz; alpha, 10–12.5 Hz; beta 17.5–22.5 Hz; gamma 60–80 Hz; the spectral resolution of 2.5 Hz is considered). Note, oscillatory peaks are present in all pre-selected frequency bands in the spectral profile of the averaged maintenance activity. (B) The sensor-space time-frequency representations of low (left; <36 Hz) and high (right; >36 Hz) frequencies are depicted separately for the low load (top) and the high load (bottom) conditions, averaged across all electrodes and across participants of all training groups. Stimulus-locked (0 s, solid black line) spectral power from –1.6 to 1.6 s (stimulus duration 0.45 s, right dashed black line) is expressed in percent change (Rel. change in%) relative to baseline activity (–0.2, left dashed black line; to 0 s, solid black line). Colored boxes highlight the pre-selected frequency-bands that were used for further analyses (left: red, theta; blue, alpha; black, beta; right: blue, gamma). Note the sustained increase of band-specific activity during the maintenance period (–1.1 to –0.2 s, colored boxes). In further analyses only this maintenance period was analyzed, since the rest of the trial may be overlaid by reaction times (cf. Figure 1B).

