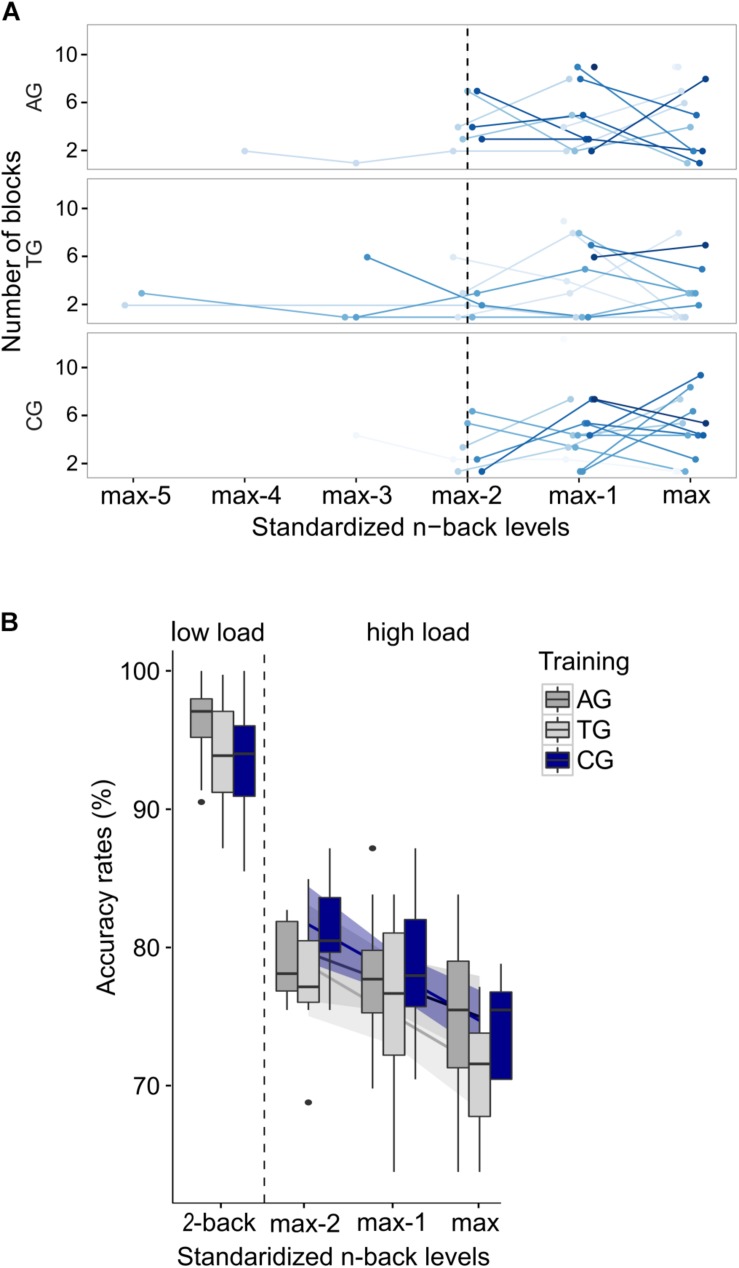
FIGURE 3.
Preprocessing in behavioral n-back data. (A) Individual frequency distribution of all prevailing recoded n-back levels is depicted for each group (“max” represents the highest n-back level, an individual reached in the adaptive high load condition; “max–1,” “max–2,” etc. represent the remaining n-back levels, coded in a descending order). Single lines (blue color-coding) represent individual data. Data from the three individually highest n-back levels (left of the dotted line) were included in the following analyses. (B) Mean accuracy rates are shown separately for each group and load condition; and for each n-back level in the adaptive high load condition. Error bars indicate one standard error of the corresponding mean.

