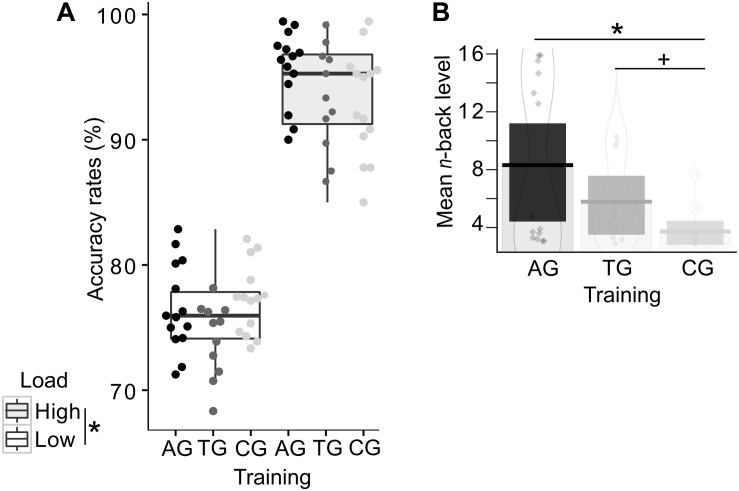
FIGURE 4.
Behavioral training effects in the auditory n-back task. Single dots represent individual data. (A) Accuracy rates are displayed separately for each group and load condition, demonstrating the load effect irrespective of group affiliation. Color-coded dots represent individual data. Error bars indicate the standard error of the corresponding mean. (B) The mean absolute n-back level (i.e., not recoded) is shown per group, with highest mean n-back levels in the auditory training group (AG), followed by the tactile training group (TG), and finally, the active control group (CG). Both training groups reached higher n-back levels (AG: significance; TG: tendency) compared to the active control group (CG). Asterisks indicate significance, the plus-symbol indicates marginal significance.

