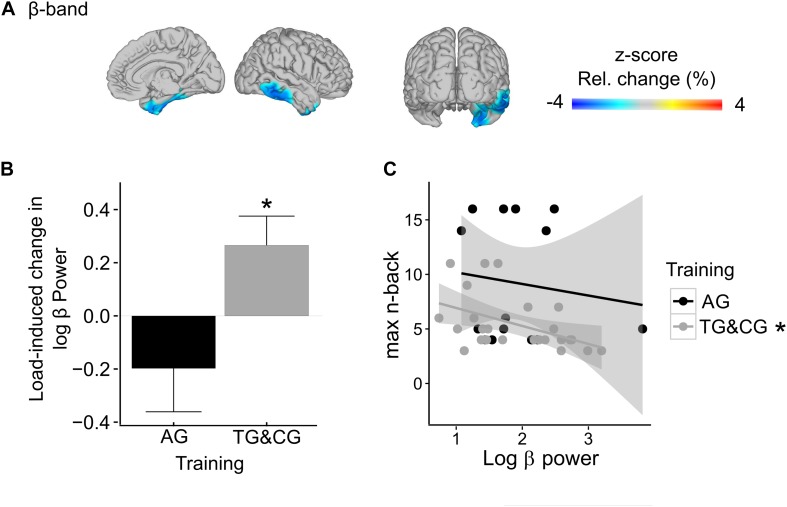
FIGURE 6.
Training-related differences in WM load effects (AG vs. TG&CG)* in beta-band power (17.5–22.5 Hz). (A) The observed significant interaction between training and WM load in the right medial temporal lobe is projected onto a glass brain. In interaction-sensitive voxels, color-coding represents z-scores in power change between conditions. Note, light-blue to dark-blue colors indicate reduced load effects in the AG relative to the TG and CG. (B) The bar graph shows the load-related power changes separately for AG and TG and CG, pooled across all interaction-sensitive voxels. (C) The relationship between beta-band power in the right medial temporal lobe and maximally reached n-back levels in the adaptive high-load condition is depicted separately for AG and TG and CG, showing a negative correlation for the tactile training group and the control group, but not for the auditory training group. Asterisks indicate significance. * AG, auditory WM training group; TG, tactile WM training group; CG, active control group.

