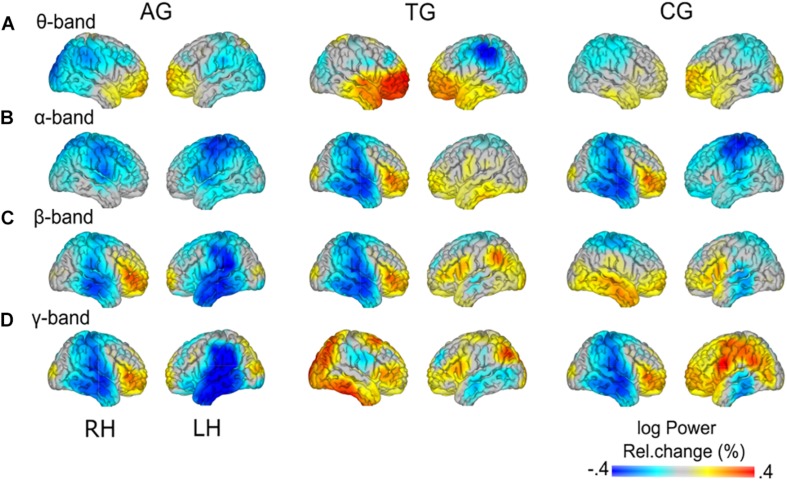
FIGURE 8.
Group-specific load effects. Load-related power changes (log power) are depicted for (A) theta- (2.5–5 Hz), (B) alpha- (10–12.5 Hz), (C) beta- (17.5–22.5 Hz), and (D) gamma-band (60–80 Hz), separately for the three training groups (AG, auditory training group; TG, tactile training group; CG, active control group). Note the group-specific differences in load effects (cf. Figure 7) vs. similarities (cf. Figure 8) in load effects across groups.

