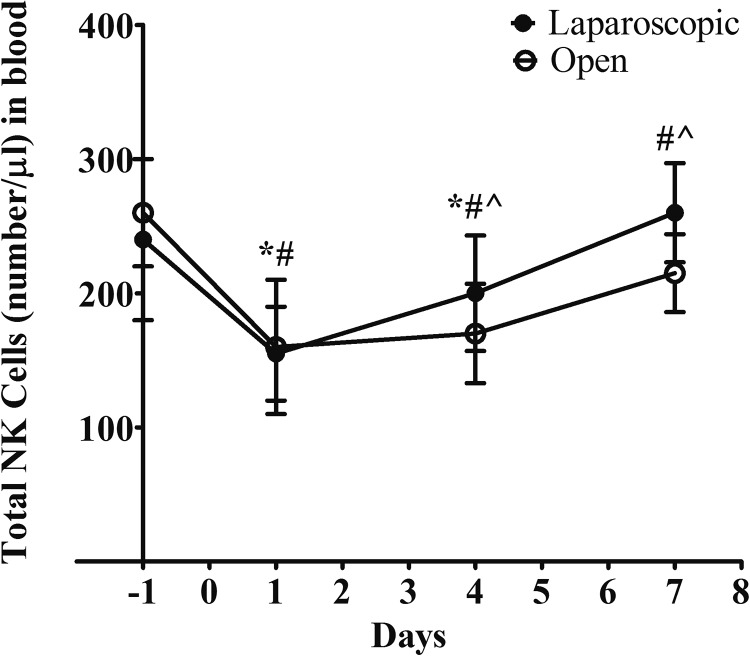
Figure 2.
Comparison of the numbers of natural killer (NK) cells between the surgery groups at different time points. The number of NK cells in blood (absolute counts/µL) was measured by flow cytometer. Values were shown as mean with standard deviation. Statistical analysis: *P < .05 within-group effect in laparoscopic group per analysis of variance (ANOVA); # P < .05 within-group effect in open group per ANOVA. ^P < .05 cross groups at the indicated time point per Student t test.

