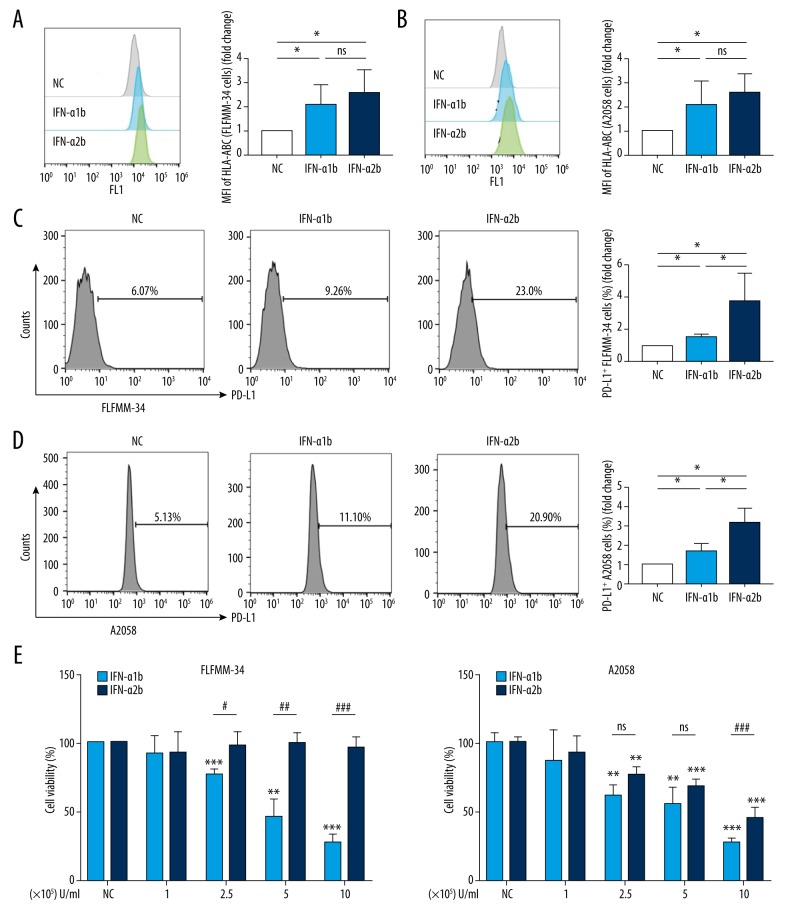
Figure 4.
Effects of IFN-α1b/IFN-α2b on immunomodulatory activities and growth of melanoma cell lines. (A, B) HLA-ABC levels (fold change of MFI) in FLFMM-34 and A2058 cell lines after IFN-α1b/IFN-α2b (0 and 1000 U/ml) treatment for 48 h (n=4). Statistical analyses were performed with the Mann-Whitney test (* P<0.05; ns – not significant). (C, D) Representative histogram and statistical analysis of the expression of PD-L1 (fold change of percentage) in FLFMM-34 and A2058 cell lines after IFN-α1b/IFN-α2b (0 and 1000 U/ml) treatment for 48 h (n=4). Statistical analyses were performed with the Mann-Whitney test (* P<0.05). (E, F) Cell viability of FLFMM-34 cells and A2058 cells was determined by the CCK8 assay after treatment with IFN-α1b/IFN-α2b at various concentrations (1×10⁵–1×10⁶ U/ml) for 48 h (n=3). Statistical analyses were performed with unpaired t tests (*/# for P<0.05; **/## for P<0.01; ***/### for P<0.001, and ns – not significant). Asterisks (*) show comparisons with untreated controls; hashtags (#) indicate comparisons between treatments.

