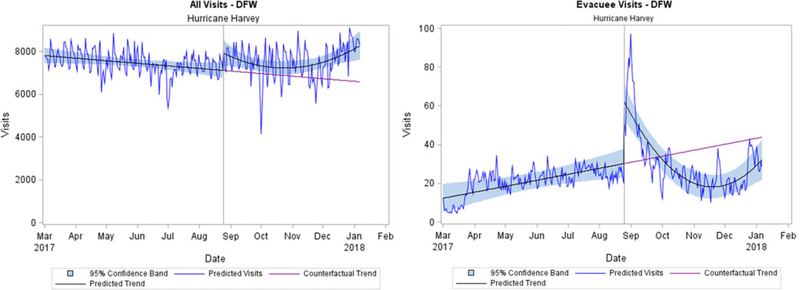
FIGURE 2. Predicted Visits from Interrupted Time Series (ITS) Models of Daily Emergency Department Visits compared to counterfactual trend, Metropolitan Dallas–Fort Worth, TX, March 1 2017–January 6, 2018.
Note predicted visits are those predicted by the ITS model. Predicted trend is structural tred predicted by ITS model. Counterfactual trend assumes that no event occurs to interrupt the time series.
Reference line “Hurricane Harvey” is August 25, 2017, the date that Hurricane Harvey made landfall in Texas. Evacuee visits are visits by patients that reported zip codes indicating residence in any of the 60 counties with emergency declarations due to Hurricane Harvey.
95% confidence band represents the confidence interval around the predicted structural trend.

