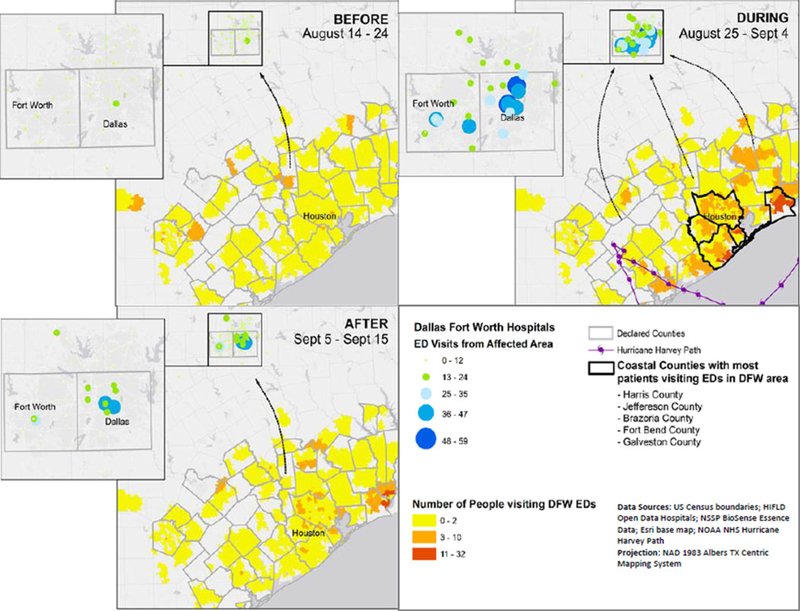
FIGURE 3. Spatial Analysis of Surge in Evacuees Presenting for Care at Emergency Departments in the Dallas-Fort Worth Area Before (August 14–24, 2017), During (August 25–September 4, 2017), and After (September 5–15, 2017) Hurricane Harvey.
The zip codes in declared counties are represented with a yellow-to-dark-orange scale, representing the number of emergency department visits in Dallas-Fort Worth hospitals from people with residential zip codes in emergency-declared counties. The green-to-blue graduated circles represent the number of emergency department visits in Dallas-Fort Worth hospitals from people who reside in Texas counties with disaster declarations.

