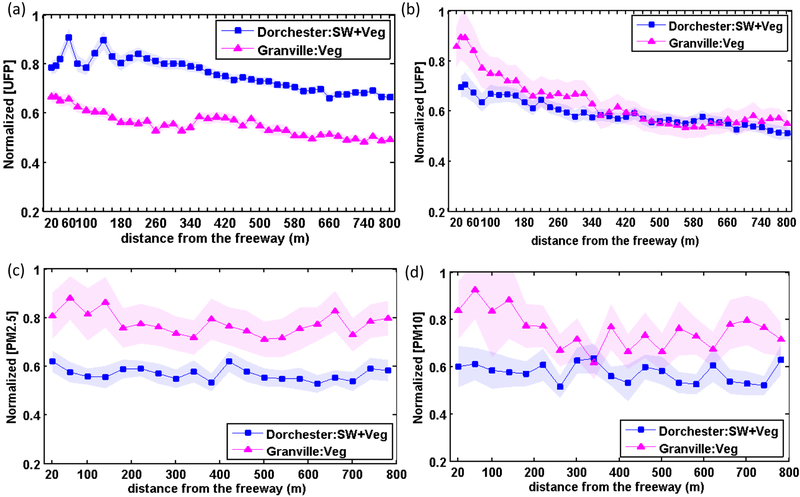
Fig. 2.
The normalized (a, b) UFP number concentration and (c) PM2.5, (d) PM10 mass concentration along the two transects under perpendicular wind conditions for (a) summer-fall 2015 and (b, c, d) Winter 2016 measurement sessions. The traffic-normalized concentration averaged over (a) 8 and (b, c, d) 5 sessions (lines) is plotted together with the standard error of the mean (shaded areas).

