Figure 5.

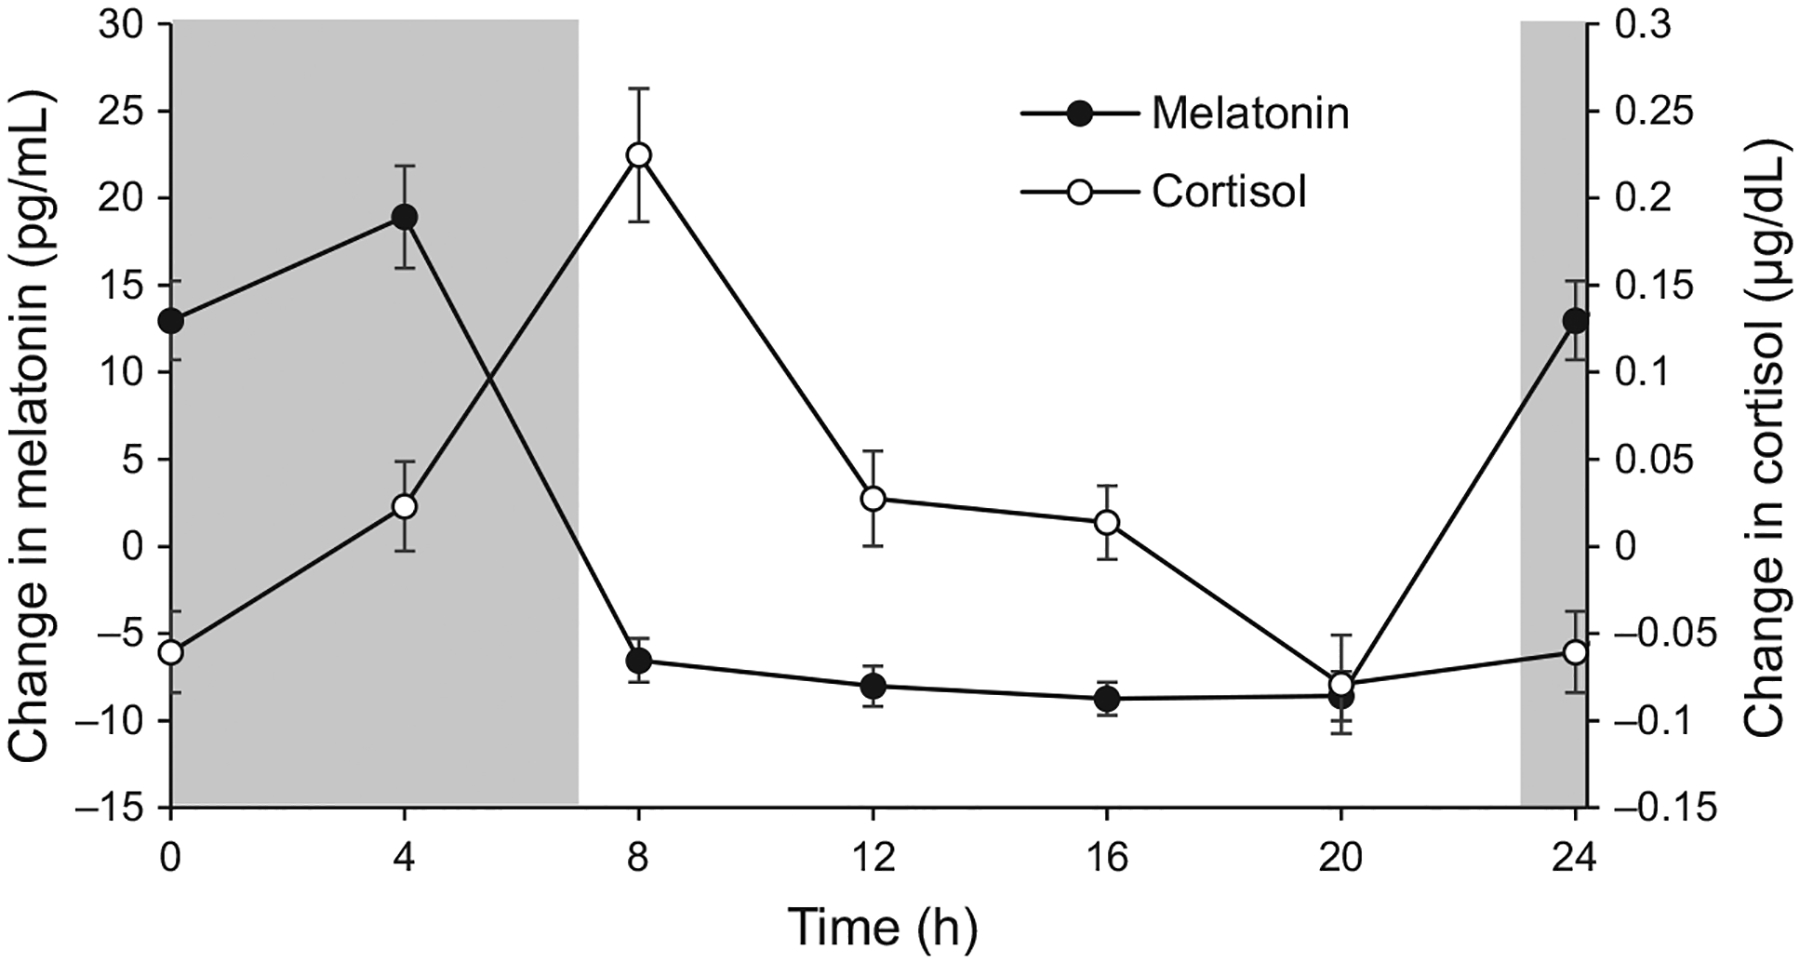
Mean (± standard error) change in melatonin concentration (filled symbols) and cortisol concentration (open symbols) across 24 h for all subjects (melatonin n = 16, cortisol n = 17); grey areas represent the dark period.

Mean (± standard error) change in melatonin concentration (filled symbols) and cortisol concentration (open symbols) across 24 h for all subjects (melatonin n = 16, cortisol n = 17); grey areas represent the dark period.