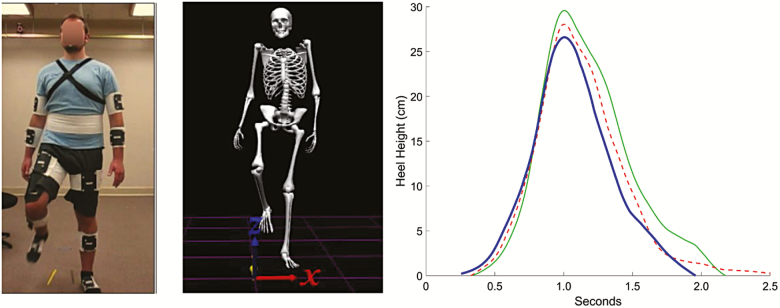
Figure 2.
Foot lift task. Left image shows peak of foot lift task (frontal view) modeled by a young research assistant, wearing the reflective marker clusters. Middle image shows the peak foot lift based on motion capture data. Right image shows mean heel height across participants during foot lift trials in three conditions. Solid green line = Light. Red dashed line = Effortful. Heavy blue line = Relax. The red line does not return to zero because in the Effortful condition, some participants did not return their heels all the way to the ground.

