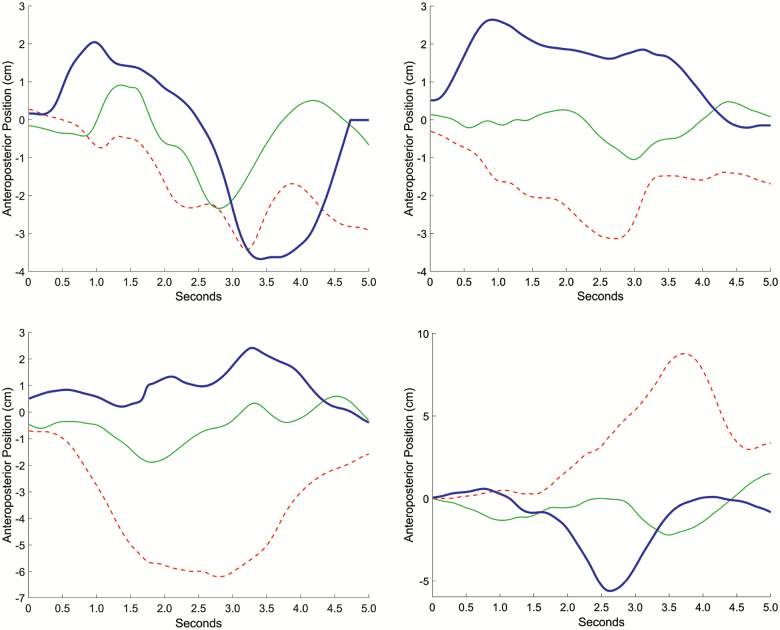
Figure 3.
Anteroposterior center of mass. Representative traces of center of mass position in anteroposterior axis with respect to the ankle during individual foot lift trials. Data from four different participants are shown in three conditions. Red dashed line = Effortful. Solid green line = Light. Heavy blue line = Relax.

