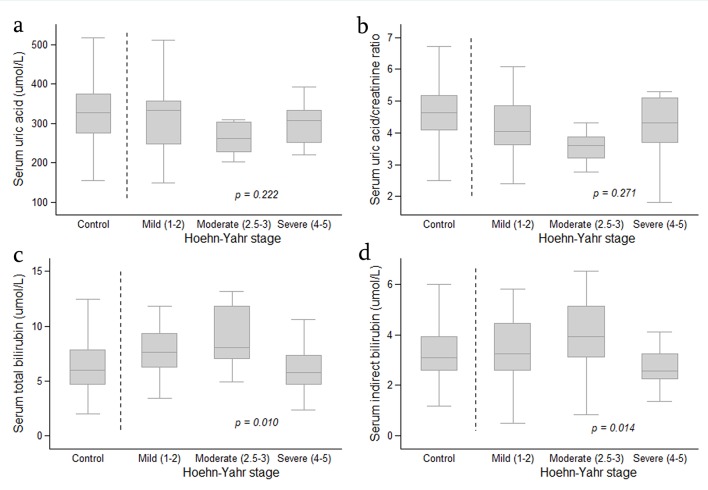
Figure 1.
Boxplot graph showing distribution of serum uric acid level (a), serum uric acid/creatinine ratio (b), serum total bilirubin (c) and serum indirect bilirubin (d) in the controls and in patients with Parkinson’s disease (according to Hoehn-Yahr stage). The analysis was performed by Fisher’s least significant difference (LSD) test and was controlled by age and co-morbidities. Data are expressed as median, 25-75 percentile and minimum-maximum.

