. 2020 Mar 2;12(3):165–171. doi: 10.14740/jocmr4098
Copyright 2020, Higashikawa et al.
This article is distributed under the terms of the Creative Commons Attribution Non-Commercial 4.0 International License, which permits unrestricted non-commercial use, distribution, and reproduction in any medium, provided the original work is properly cited.
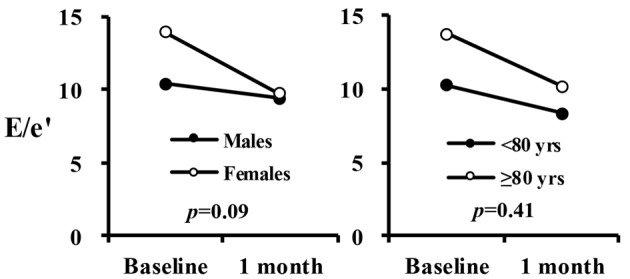
Figure 1.

Interaction plot in E/e′ between time, gender and age.
