
Fig. 2.
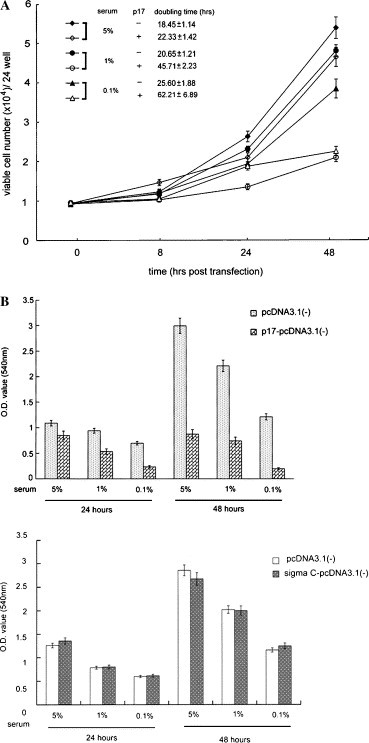
Retardation of cell growth by ARV p17. (A) The growth curve and doubling time of Vero cells transfected with vector pcDNA3.1(−) or with p17-pcDNA3.1(−). The data represent the average of triplicate plates with standard deviation. The cultured condition was shown. The x-axis represents the time period incubation post-transfection. The viable cells were counted with a hemocytometer in the presence of trypan blue and are represented in the y-axis. (B) p17 expression retards cell proliferation by using the MTT assay. Vero cells transfected with pcDNA3.1(−) or p17-pcDNA3.1(−) or sigma C-pcDNA3.1(−). The x-axis indicates cultured time period and condition. The y-axis represents the row OD value. For a 24 and 48 h observation, p17-expressing cells reduced the cell proliferation. More remarkable effect was observed when cells were cultured in lower serum medium (upper). Cell growth rate of cells transfected with control vector or sigma C-pcDNA3.1(−) was comparable (lower).