
Fig. 2.
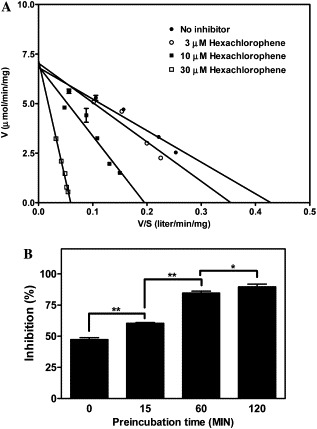
Kinetic analysis of the inhibition of SARS-CoV 3CLpro by hexachlorophene. (A) Lineweaver–Burk plot. The assay was performed for 15 min at 25 °C in buffer B using 20 nM enzyme and different concentrations of the FRET peptide (Abz-SAVLQSGFRK-DNP) in the presence of 0, 3, 10, or 30 μM hexachlorophene. (B) Effect of preincubation. The mixture containing 20 nM SARS-CoV 3CLpro and 10 μM hexachlorophene in buffer B was preincubated for different times at 25 °C, then 30 μM FRET peptide was added and incubation was continued for a further 15 min at 25 °C, and then the percentage inhibition was calculated. The data are means ± SD for three separate experiments. The linear regression curves were plotted using GraphPad Prism. The P values were derived using a two-tailed t test; *P < 0.05, **P < 0.01.