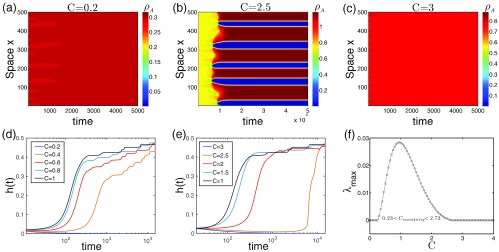
FIG. 3.
The impact of contagion interactions. Upper row: The spatiotemporal evolution of overall density of infection A () for , which shows that strong competition, e.g., in (a) or strong cooperation like in (c) actually inhibits patterns. (b) A case with a relatively strong interaction () that takes a long time to develop patterns. Lower row: for a couple of interaction indicates that patterns are most likely to happen in the case of [(d) and (e)]; any deviation to a smaller or larger value will delay or just fail to have the formation process. (f) Eigenvalue analysis shows that the pattern appears within , where and the peak is around , in line with the observations here. Parameters: , , . Random initial conditions are used in (a)–(e).

