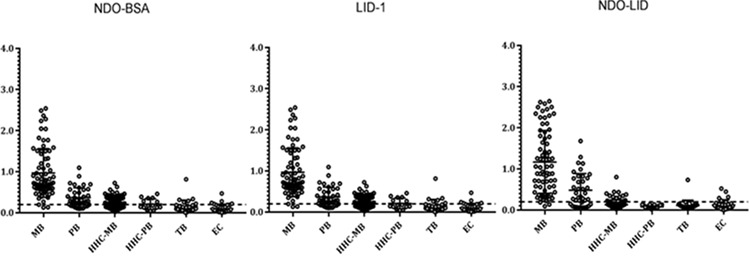
Figure 3.

Antigen-specific responses among the broader population. Sera from multiple groups were analysed for antibodies against LID-1 (IgG), NDO-LID (IgG and IgM) and NDO-BSA (IgM). The leprosy patient group contained 113 total samples, the HHC-MB group contained 93, the HHC-PB group contained 15, TB patients contained 27 and ECs contained 31. Each point represents the OD of an individual serum sample, with the mean OD and 95% CI represented by the horizontal bar. The traced horizontal line depicts the threshold for determining a positive result (OD=0.2).
