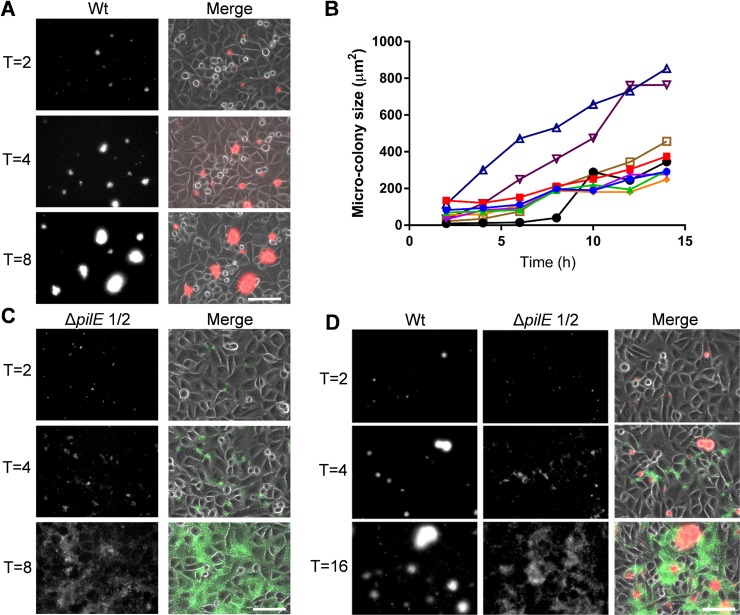
Fig 4. N. cinerea Tfp are required for microcolony formation and fusion.
(A) Epithelial cells were infected with N. cinerea wild-type (Wt) expressing sfCherry for 16 h. Images were captured at 10 min intervals; time points 2, 4 and 8 h are shown. (B) Microcolony size was quantified by measuring their surface area. Each line corresponds to a single microcolony tracked over time. Data shown are for eight microcolonies from one representative experiment of three independent experiments. (C) Epithelial cells infected with N. cinerea 346TΔpilE1/2 expressing GFP. Images were captured at 10 min intervals, and images from 2, 4 and 8 h post infection are shown. (D) Epithelial cells co-infected with wild-type N. cinerea (Wt, red in merge) and the pilE mutant (ΔpilE1/2, green in merge). Images are representative of three independent experiments performed in triplicate. In each case merged panels show both phase-contrast and fluorescence channels (GFP and Texas Red). Scale bars, 75 μm.

