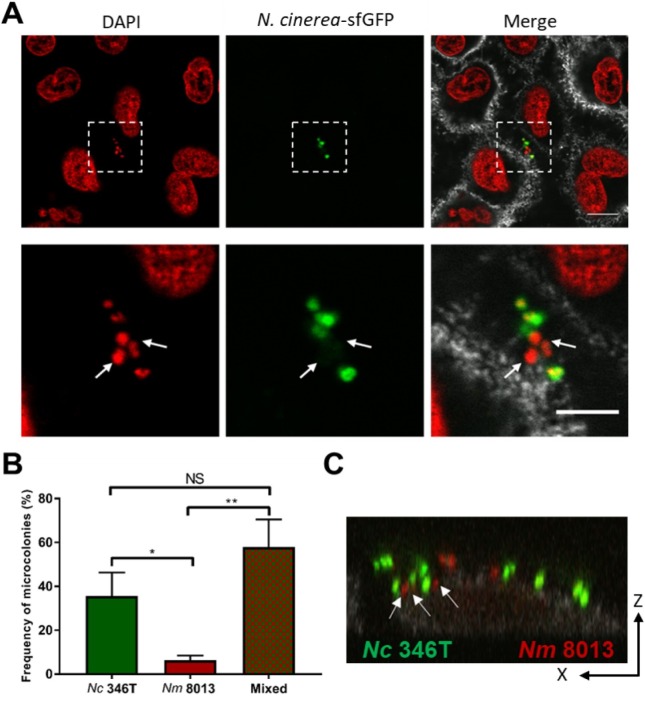
Fig 5. N. cinerea and N. meningitidis form mixed microcolonies on epithelial cells.
(A) Representative images of epithelial cells co-infected with N. cinerea (N. cinerea-sfGFP) and N. meningitidis for 3 h. Lower panels are enlarged images of boxed area in upper panels. Nuclei and bacterial DNA were stained with DAPI (red). Each DAPI stained spot corresponds to a single bacterium (left-hand and merge panels). White arrows indicate N. meningitidis (DAPI positive, GFP negative) within a mixed microcolony. CD44 is shown in grey (merge panels). Scale bar, 10 μm. (B) Frequency of mixed or single species microcolonies quantified by confocal microscopy. Data shown are from at least 150 microcolonies in three independent experiments; the number of mixed microcolonies was expressed as a percentage of all microcolonies. NS, not significant; *, p<0.05; **, p< 0.005 (one-way ANOVA). (C) XZ optical section analysis of a mixed microcolony containing N. meningitidis (Nm 8013, red) and N. cinerea (Nc 346T, green) on epithelial cells. White arrows show N. meningitidis in close contact with N. cinerea on the cell surface.

