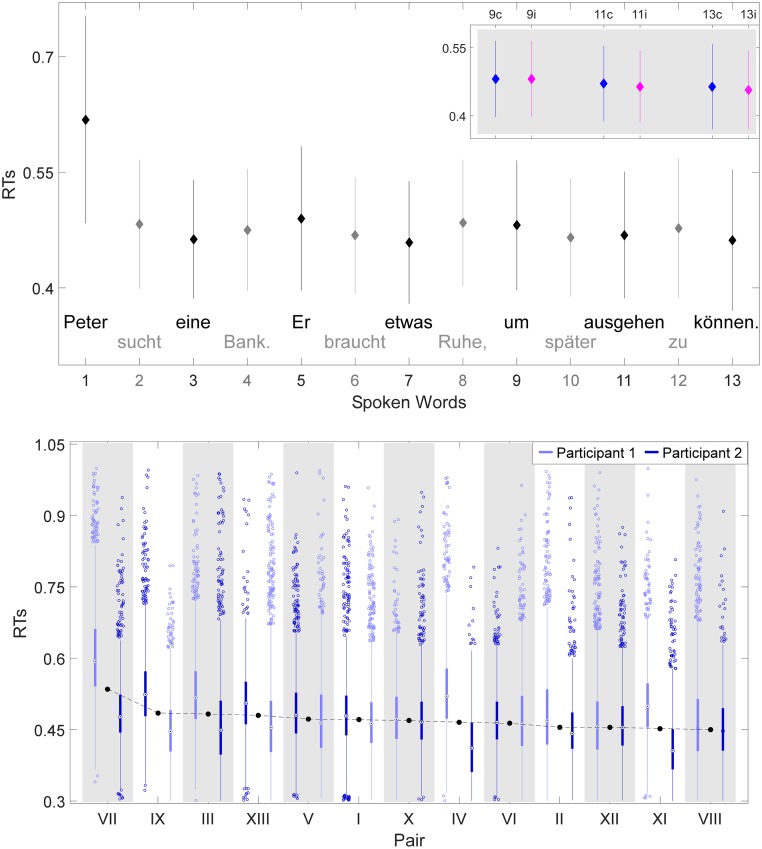
Fig 2. Behavioral results: Speech times and reaction times.
(A) Grand average speech times for the spoken words 1 to 13. Error bars show standard deviations. Average word length (number of letters) is shown for each word. The sentences were uttered by both participants taking turns for each word: e.g., the black colored words by one participant and the grey colored words by the other participant. (B) Grand average reaction times (RTs) to speech onset—from visual presentation to speech onset—for the spoken words 1 to 13. Vertical bars represent standard deviation. One trial was produced by both participants: e.g., the black colored odd words by one participant, whereas the grey colored even words by the other participant. A generalized linear mixed effects model (GLMM) was computed for CW+1, CW+3, CW+5 (on gray background), that are split into congruent (blue dots) and incongruent conditions (magenta dots) for the participant speaking. Sentence translation: ‘Peter searches a bench. He needs some rest, to be able to go out later.

