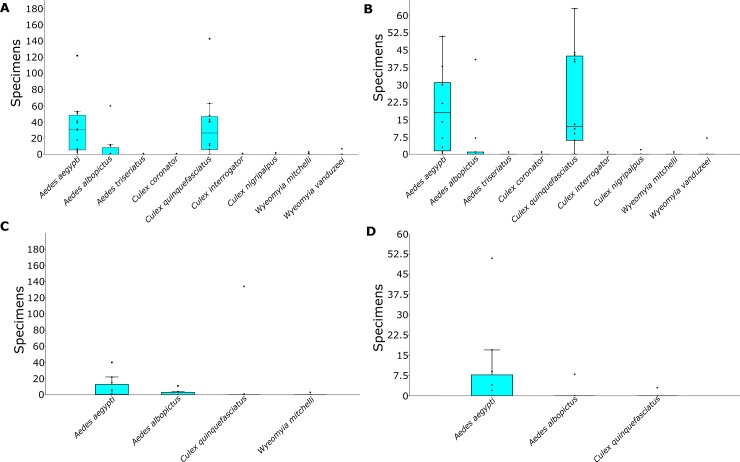
Fig 2. Box plot graph displaying the total number of mosquitoes collected in the twelve cemeteries surveyed in Miami-Dade County, Florida.
(A) All collected mosquitoes; (B) adult mosquitoes; (C) larvae; and (D) pupae. Boxes represent the 25–75 percent quartiles; the horizontal line inside the box represents the median; the whiskers represent the largest data point less than 1.5 times the box height; and values further that limit are shown as outlier dots.

