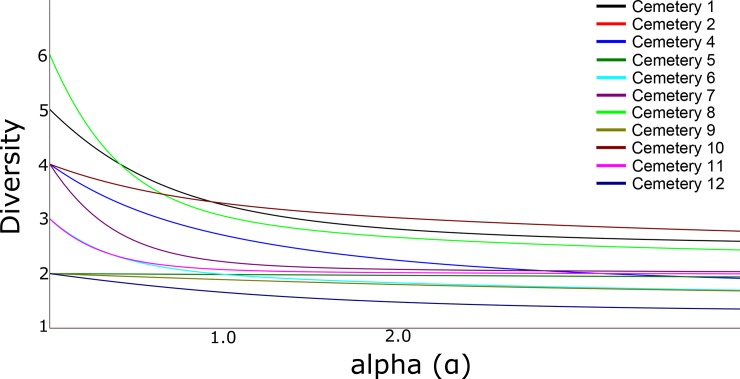
Fig 3. Diversity profiles considering the mosquito species collected in cemeteries in Miami-Dade County, Florida.
Values at α = 0 represent the total number of species for each cemetery; values at α = 1 represent an index proportional to the Shannon index (i.e., a lesser amount of importance to the presence of rare species); and values at α = 2 represent an index proportional to the Simpson index (i.e., a higher amount of importance to the presence of frequent species rather than rare species).

