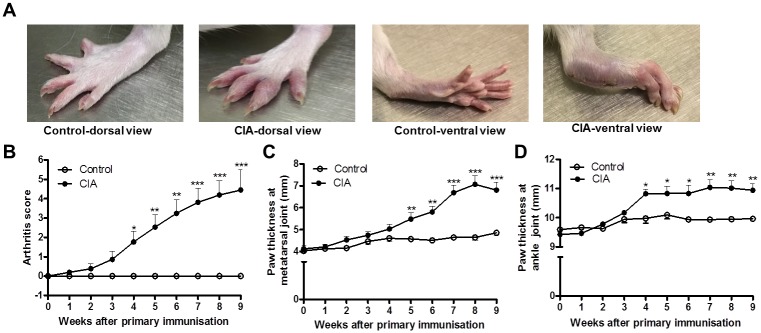
Fig 1. Macroscopic observation of joint swelling in collagen-induced arthritis (CIA) rats.
(A) Photographs of hind paws, (B) arthritis scores, (C) paw thickness at the tarsometatarsal joint and (D) paw thickness at the ankle joint in control and CIA rats nine weeks after the primary immunisation. Open circles represent the control group (n = 12) and closed circles represent the CIA (n = 21) group (unpaired t-test). Data presented as mean ± SD. *P < 0.05 versus control group; **P < 0.01 versus control group; ***P < 0.0001 versus control group.

