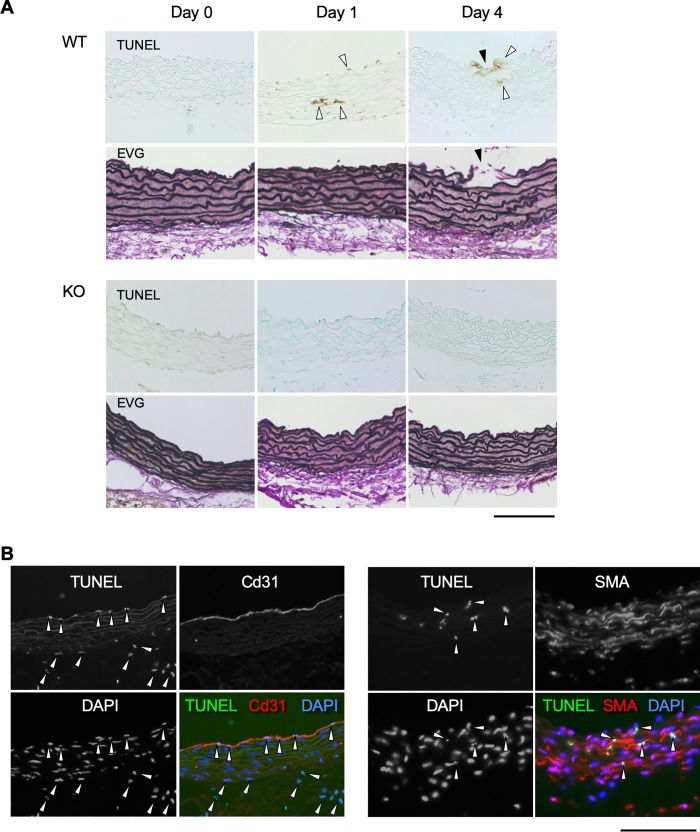
Fig 5. Apoptosis in mouse AD model.
(A) Representative histological images are shown with TUNEL and EVG staining. The samples are from WT or MRTF-A-KO mice before (Control) and 1–4 days after starting AngII administration. White arrowheads indicate TUNEL-positive cells. Black arrowheads indicate the tear. (B) Immunofluorescence staining for Cd31, SMA, TUNEL and DAPI on ascending aortae are shown from WT mice 1 day after AngII administration. White arrowheads indicate TUNEL-positive nuclei. Bars 0.1 mm.

