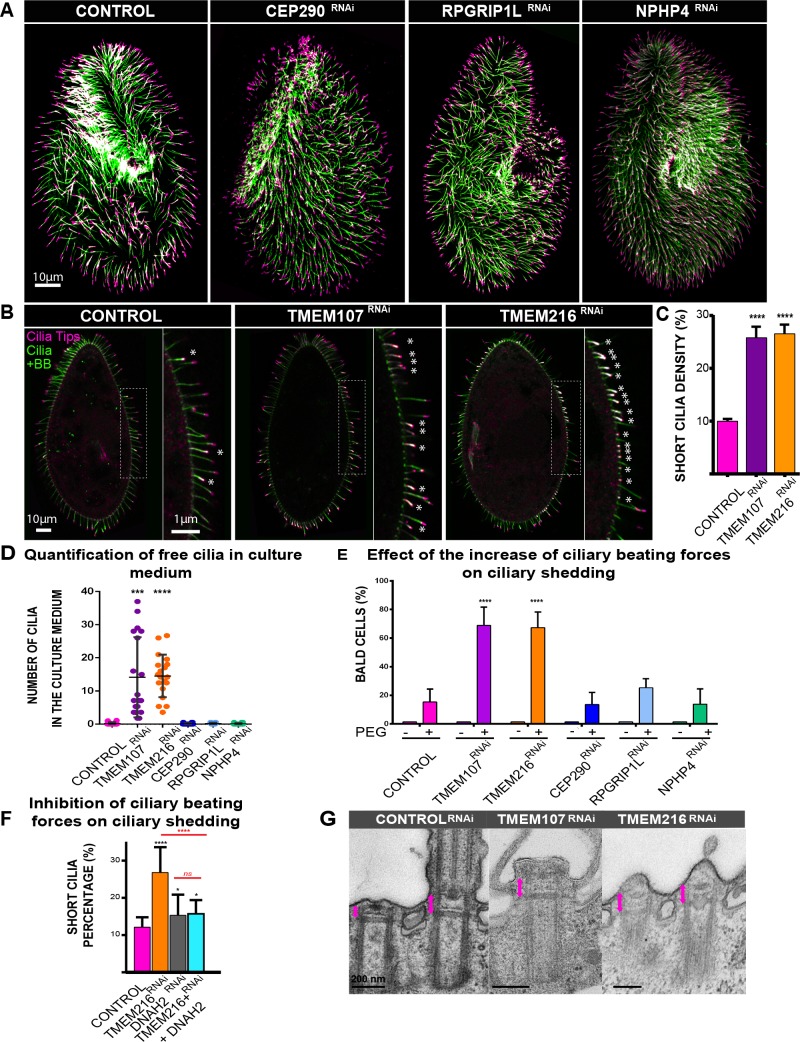
Fig 2. Ciliary pattern of paramecia depleted for TZ proteins.
(A) Ciliary pattern of paramecia treated with control RNAi or TZRNAi (CEP290, RPGRIP1L, and NPHP4). Cells were immunostained by the monoclonal anti-mono-glycylated tubulin TAP952 (magenta, cilia tip labelling) and the polyclonal anti-poly-glutamylated tubulin (polyE) antibodies (green, decorating BB and cilia). These TZ-protein–depleted paramecia display a ciliary pattern similar to that of control paramecia. (B) Control, TMEM107-depleted, and TMEM216-depleted paramecia stained for cilia using TAP952 (magenta) and the poly-E tubulin (green). Control paramecia show the usual ciliary pattern with long cilia (10 μm) and a few short growing cilia indicated by asterisks. A large increase in short (about 4 μm) or tiny cilia is observed in TMEM107- and TMEM216-depleted cells. Bar = 10 μm. (C) Bar plot showing the mean percentage of short cilia in Control (n = 60 cells, 3 independent replicates), TMEM107 (n = 50 cells, 3 independent replicates), and TMEM216-depleted (n = 42 cells, 3 independent replicates) cells. Error bars show the SEM. Statistical significance was assessed by an unpaired t test, two-sided p < 0.0001****. Source data can be found in S2 Data. (D–G) Ciliary shedding in TMEM107- or TMEM216-depleted cells. (D) Quantification of free cilia in culture medium: dot plot showing the number of free cilia found in the culture medium (about 10 microscope fields were analyzed per experiment; see Materials and Methods). Two independent replicates. Cilia were labelled using ID5 and poly-E antibodies. Error bars represent the standard deviation. Statistical significance was assessed by an unpaired t test. ***p = 0.0004, ****p < 0.0001. Source data can be found in S2 Data. (E) Effect of the increase of ciliary beating forces on ciliary shedding quantification of the mean number of bald cells (<25% cilia per cell) after 1 h in 10% PEG for control (n = 410 cells, 8 independent replicates), TMEM107RNAi (n = 316, 5 independent replicates), TMEM216RNAi (n = 303 cells, 5 independent replicates), CEP290RNAi (n = 291, 4 independent replicates), RPGRIP1LRNAi (n = 204, 3 independent replicates), and NPHP4RNAi (n = 196, 3 independent replicates). Errors bars represent the standard deviation. Statistical significance was assessed by unpaired two-sided χ2 test, ****p < 0.0001. Confidence interval 95% source data can be found in S2 Data. (F) Effect of inhibition of ciliary beating on ciliary shedding; quantification of the mean percentage of short cilia in Control (n = 60 cells, 2 independent replicates), TMEM216RNAi (n = 42 cells, 2 independent replicates), DNAH2RNAi (n = 15 cells, 2 independent replicates), and TMEM216-DNAH2RNAi (n = 16 cells, 2 independent replicates) paramecia. DNAH2RNAi cells present a percentage of short cilia slightly higher than the controls. Impairing ciliary beating of TMEM216RNAi cells by DNAH2 decreases this percentage. Statistical significance was assessed by unpaired two-sided t test. p-Values: *p = 0.0306, ****p < 0.0001. Source data can be found in S2 Data. (G) EM images of ciliary defects induced by TMEM107RNAi and TMEM216RNAi. ControlRNAi basal bodies showing a two-BB unit, with one unciliated and one ciliated BB. The length of the TZ is indicated by a red arrow. Cilia are either severed at the level of the axosomal plate as shown in TMEM107RNAi or have been severed and are in a regrowth process as in TMEM216RNAi. Note that the length of the TZ corresponds to the length of TZ of ciliated BB. BB, basal body; CEP290, centrosomal protein of 290 kDa; DNAH2, dynein axonemal heavy chain 2; NPHP4, Nephronophtysis 4; ns, nonsignificant; PEG, Polyethylene glycol; polyE, anti-poly-glutamylated tubulin; RNAi, RNA interference; RPGRIP1L, Retinitis pigmentosa GTPase regulator-Interacting Protein 1-Like Protein; TMEM216, Transmembrane protein 216; TZ, transition zone.

