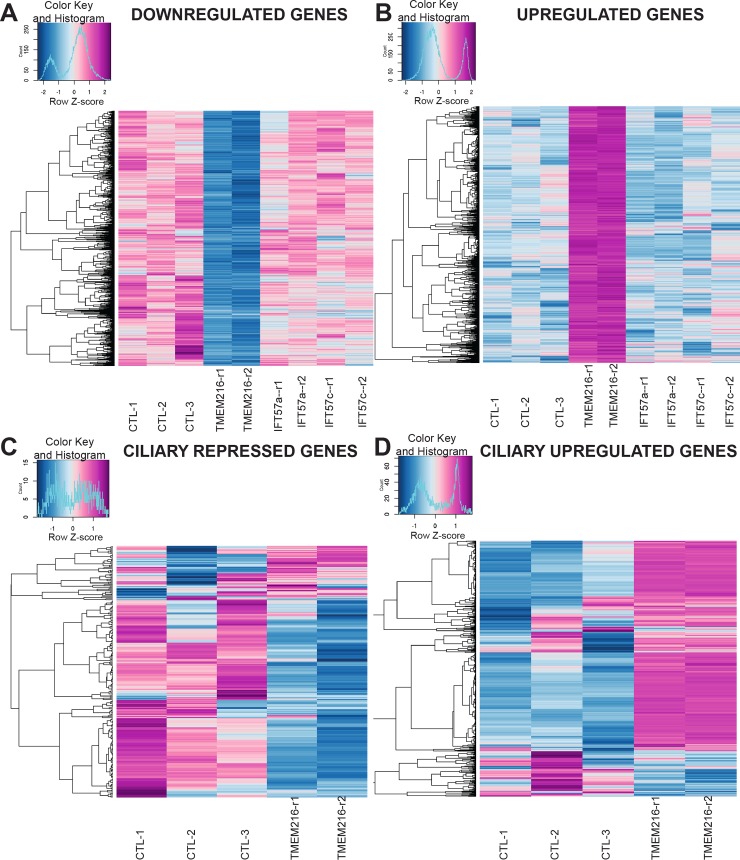
Fig 3. Transcriptomic analysis of TMEM216-depleted cells.
The heatmaps were generated by the “heatmaps.2” R function using the log2 normalized gene expression levels in the different conditions. The color keys are presented at the top left corner of each heatmap and show a color variation from dark blue to dark red according to the gene expression level. (A–B) Each line represents the expression level variation for one down-regulated gene (A) or up-regulated gene (B) when TMEM216 is depleted. The differential expression level of the genes between control biological replicates (first three columns) and TMEM216RNAi biological replicates (fourth and fifth column) is highlighted by the color variation. It is remarkable that these genes are not affected in IFT57-depleted cells (last four columns corresponding to the 4 biological replicates). (C–D) Comparison of the expression of genes differentially expressed (repressed [C] or up-regulated [D]) during the reciliation process [59] (called ciliary genes) with their expression in TMEM216RNAi and control cells. In C, the vast majority of the ciliary repressed genes are also repressed when TMEM216 is depleted. Likewise, the ciliary up-regulated genes are up-regulated in TMEM216RNAi. IFT57, intraflagellar transport 57; RNAi, RNA interference; TMEM216, Transmembrane protein 216.

