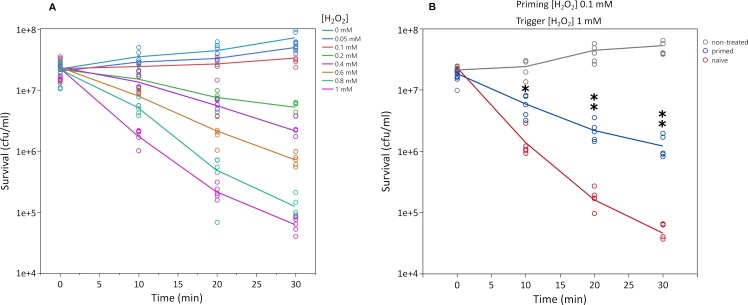
Fig 1. Hydrogen peroxide killing curves of E. coli MG1655.
Panel A shows bacterial sensitivity to 1 mM H2O2 with a strong dose-response effect (p = 2.1x10⁻¹⁶, DRC model fitted based on maximum likelihood). Panel B shows the priming effect or improved response when cells are treated in advance with a non-lethal dose (0.1 mM). Curves represent the mean of five independent cultures per time point. Asterisks represent significant differences (Welch’s test, one asterisk for p<0.05 and two asterisks for p<0.01). Only comparisons between primed and non-primed groups are shown.

